ECO 311 Midterm: ECO 311 Miami U eco311mt1Fall 1sp17 key


Eco311, First Midterm Exam, Spring 2017
Prof. Bill Even
-1-
Your Name (Please print) ____KEY – FORM 1
Your row (Please circle) 1 2 3 4 5
Directions
Place your answers to all questions in the space provided. Organize your answer so it is easy for me to
see the logic behind your answer. Clearly circle your answer to each question so it can be easily
distinguished from your work. Round all numerical answers to the nearest 100th (e.g. 1.23) unless
specifically told otherwise. Each question is worth 5 points.
The formula sheet and a table with the standard normal CDF are attached to the last page of the exam.
Eco311, First Midterm Exam, Spring 2017
Prof. Bill Even
-2-
To answer the next 3 questions, consider the following relationship between weekly earnings, age, and
age-squared that was estimated using data from the 2015 Current Population Survey.
Wkearn= -722 + 72*age - .72*age2
1. If a worker is 30 years old, use a derivative to calculate the marginal effect of one more year of
age on weekly earnings.
= 72 (2)(.72)(30)=$28.80
In the CPS data, workers can range between 16 and 85 years of age.
2. What age maximizes weekly earnings? (Your answer must between 16 and 85 years of age).
=72 2(.72) = 0 =50.0
This is a maximum because
=1.4 < 0 (.. ).
3. What age minimizes weekly earnings? (Your answer must between 16 and 85 years of age).
wkearn at age of 16=$246; at age of 85=$196. Hence, minimum must be at age of 85.
4. As an alternative to the linear model above, consider the following log-linear model of weekly
earnings:
ln(wkearn)=3.9 +.12*age-.001*age2
For a worker who is 30 years old, what is the marginal effect of an additional year of age on
weekly earnings (in percentage terms)? Be sure to include the percent sign in your answer so
that there is no ambiguity.
ln()
= .12 .002 = .060 =30
6.0% 30.
Eco311, First Midterm Exam, Spring 2017
Prof. Bill Even
-3-
To answer the next 2 questions, consider the following hypothetical data on the number of years of
schooling among adults and the corresponding probabilities of each level of schooling.
Years of
schooling
10
12
14
16
18
20
Probability
.1
.4
.1
.2
.1
.1
5. What is the expected value of years of schooling?
=.
6. What is the variance of years of schooling?
(14.2)=.
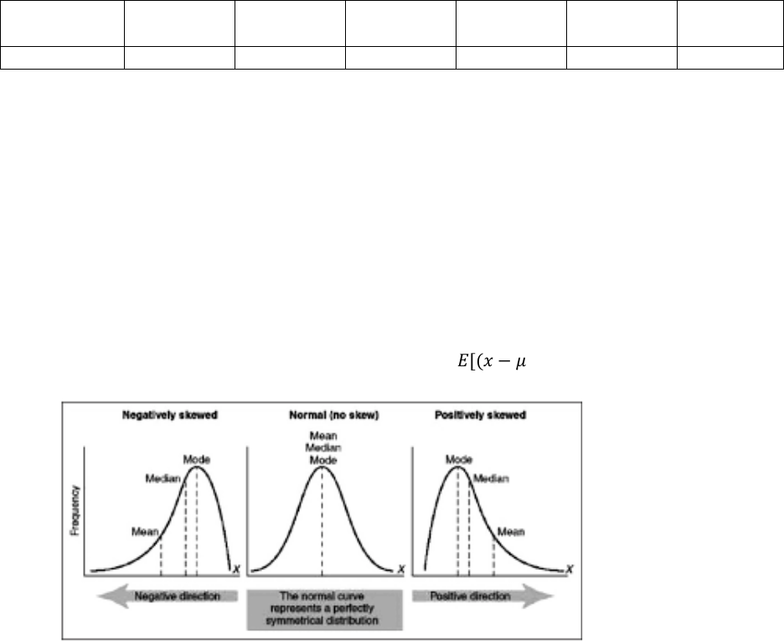
7. The “skewness” of the distribution of is measured as [( )] where =().
Distributions with positive, negative, and zero skewness are given below.
What is the measure of skewnesss for years of schooling?
(14.2)=.


