PSY 3392 Midterm: CHAPTER 11 - Getting to know your data

27 Mar 2019
School
Department
Course
Professor
CHAPTER 11: GETTING TO KNOW YOUR DATA
• First two steps of data analysis
o 1. Prepare data for analysis
▪ “data cleaning” and correcting errors
▪ Examining distributions
o 2. Summarize the data (descriptive stats)
▪ Central tendency and dispersion
▪ Graphs and tables
• 1. Prepare the data for analysis
o Set up the data spreadsheet
o Import to statistical software
o Clean the data
▪ Duplicate cases (online data collection especially)
▪ Missing values
▪ Impossible values
▪ Outliers
o Calculate scores
▪ Reverse scores; transform score
▪ Compute scores (e.g., totals, means)
▪ Compute composite variables (e.g., SES)
o Examine the distribution closely!
▪ Use pictures of the data before deciding on a mean or median to report
• Boxplot (aka box and whiskers)
o Median
o Interquartile range: middle 50% of data
o Whiskers: what is outside the middle 50%
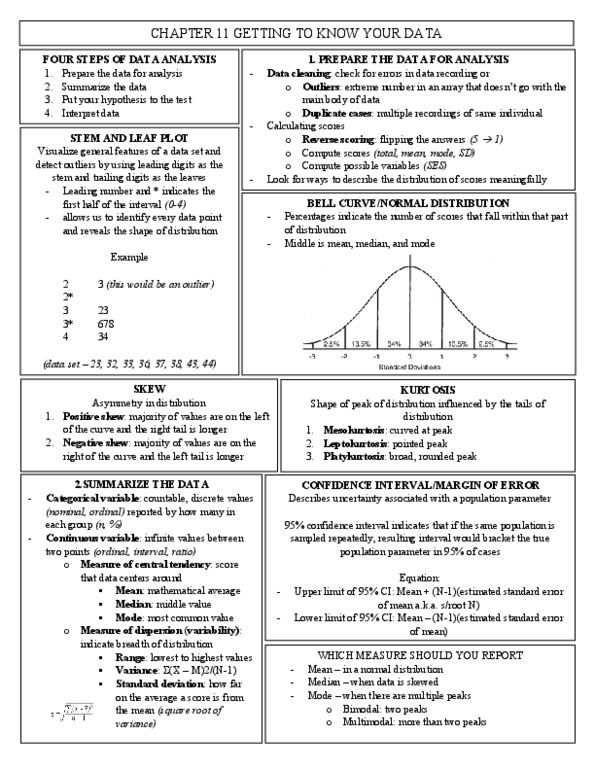
• Stem and Leaf
o Good if you don’t have software
o Particularly useful for visualizing the general features of a data set and for detecting
outliers
o Stems – leading digits in a numerical array
o Leaves – trailing digits
o Asterisk by number means list every number prior to the stem
• Frequency histograms
o Used to portray the (grouped) frequency distribution of a variable at the interval or
ratio level of measurement
o Height of the bar corresponds to the frequency
• Normal distribution: the bell curve
o Symmetrical
o Average is in the middle
o Percentages indicate the number of scores that fall within that part of the
distribution
o Bell curve
▪ Middle of bell curve – same as others
▪ Just left of middle – probably more than others