BUSS1020 Chapter Notes - Chapter 14: Box Plot, Test Statistic, Standard Deviation

28 May 2018
School
Department
Course
Professor

CHAPTER 14: SIMPLE LINEAR REGRESSION
• Regression analysis is used to:
o Predict the value of a dependent variable (Y) based on the value of at least one independent variable (X)
o Explain impact of changes in an independent variable on dependent variable
• Terms:
o Dependent variable (Y): variable we wish to explain/predict à response variable
o Independent variable (X): variable used to explain/predict Y à explanatory variable, feature, factor,
regressor, predictor
TYPES OF REGRESSION MODELS:
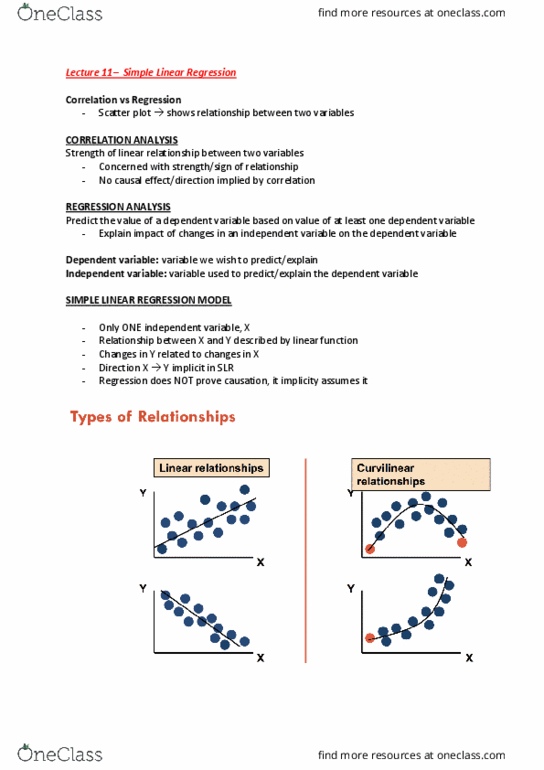
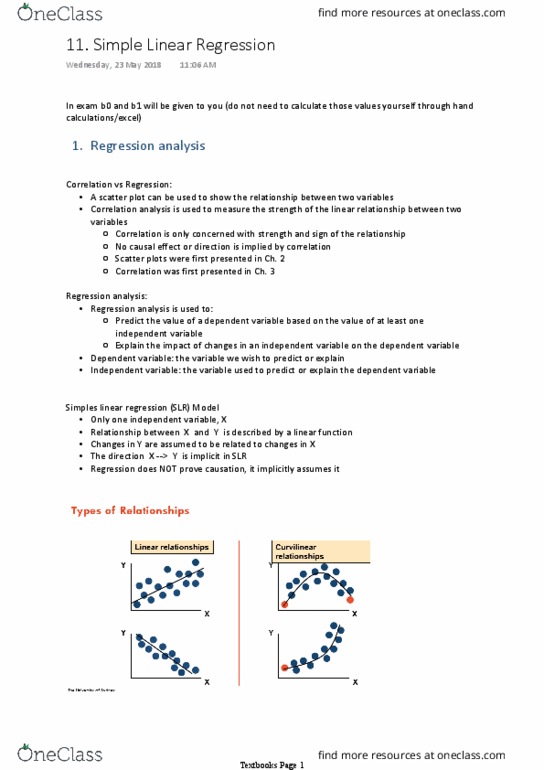
• Scatter plot: to show the relationship between two variables
o Linear relationship (pos, neg)
o Curvilinear relationship (pos, u-shaped, neg)
o No relationship
o Correlation analysis: to measure strength of linear
relationship b/w 2 variables
§ Concerned with strength and sign of relo
§ No causal effect or direction implied
• Simple linear regression models (SLR):
o
o Properties:
§ One independent variable, X
§ Relationship between X and Y described by a linear function
§ Changes in Y assumed to be related to changes in X
o Prediction line:
§ Predicted value of Y = Y intercept + slope x value of X
o The Least Squares Method:
§
§ b0 and b1 are obtained by finding the values that
minimise the sum of the squared differences
between Y and Yhat
§
o Interpretation of the slope and intercept:
§ b0 is the estimated mean value of Y when X = 0
•
§ b1 is the estimated change in the mean value of a one unit increase in X (i.e. X à X + 1)
•
§ Can interpolate, do not extrapolate (don’t exceed given values to make predictions)
ii10i εXββY++=
i10i XbbY
ˆ+=
2
i10i
2
ii ))Xb(b(Ymin)Y
ˆ
(Ymin +-=-åå
( )
0| 0EY X
b
==
( ) ( )
1|1|EY X EY X
b
=+-
Yi = dependent variable
ß0 = pop y-intercept
ß1 = pop slope coefficient
Xi = independent variable
¬i = random error term
Yi = estimated Y value for observation i
b0 = estimate of regression intercept
b1 = estimate of regression slope
Xi = value of X for observation i
Document Summary
Terms: dependent variable (y): variable we wish to explain/predict response variable. Independent variable (x): variable used to explain/predict y explanatory variable, feature, factor, regressor, predictor. Scatter plot: to show the relationship between two variables. Linear relationship (pos, neg: curvilinear relationship (pos, u-shaped, neg, no relationship, correlation analysis: to measure strength of linear relationship b/w 2 variables. Concerned with strength and sign of relo. Relationship between x and y described by a linear function. Changes in y assumed to be related to changes in x: prediction line: by i. Predicted value of y = y intercept + slope x value of x: the least squares method: Yi = estimated y value for observation i b0 = estimate of regression intercept b1 = estimate of regression slope. Xi = value of x for observation i min (y i (b. )y i b0 and b1 are obtained by finding the values that minimise the sum of the squared differences between y and yhat.