STAT2003 Chapter Notes - Chapter 15-16: Simple Random Sample, Standard Deviation, College Board


Ch 15. Sampling Distribution Models, Ch 16. Confidence Intervals for Proportions
Covers: 10/23, 10/25, 10/27, 10/30, 11/1, 11/3 ,11/6, 11/8, 11/10 (9 Lectures, Weeks 9,10, &
11)
Ch 15. Sampling Distribution Models
● Sampling Distribution of a Proportion
○ The Harris poll found that of 889 U.S. adults, 40% said they believe in ghosts.
CBS News found that of 808 U.S. adults, 48% said they believe in ghosts.
■ Why are these two sample proportions different?
■ What is the true population proportion (of ALL U.S. adults)?
○ Let’s deote the populatio proportio p, and the sample proportion p^
○ Cosider all possile saples of size … what if we made a histogram of the
number of samples having a given p^ ???
○ The Central Limit Theorem (CLT) for Sample Proportions
■ Rather than showing real repeated samples, imagine what would happen
if we were to actually draw many samples and look at their proportions
■ The histogram we would make would show us all the proportions from
all possile saples → this is called the sampling distribution of the
proportions
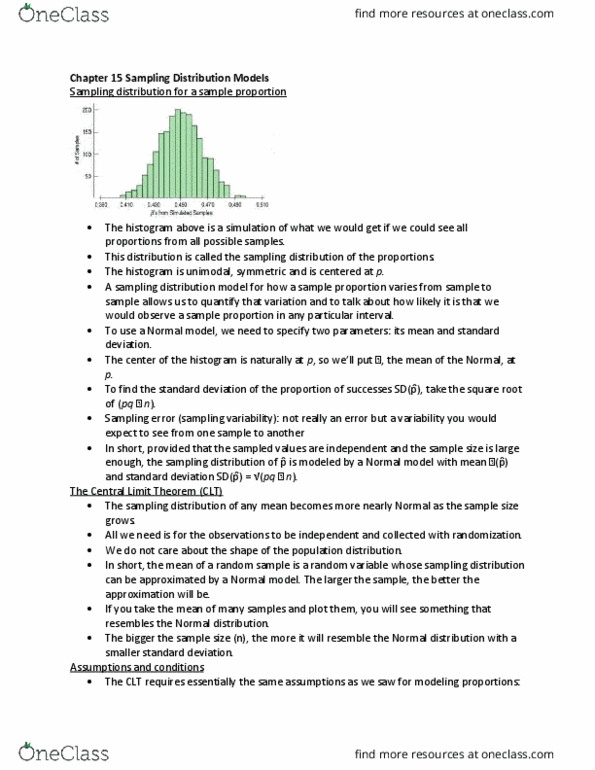
○ Here’s a E….“aplig Aout Eolutio
find more resources at oneclass.com
find more resources at oneclass.com

■
■ According to a Gallup poll, 43% believe in
evolution. Assume this is true of all Americans.
● If many surveys were done of 1007 Americans, we could calculate
the sample proportion for each.
● The histogram shows the distribution of a simulation of 2000
sample proportions.
● To reiterate: The distribution of all possible sample proportions
from samples with the same sample size is called the sampling
distribution.
○ Sampling Distribution for Proportions
■ Symmetric
■ Unimodal
■ Centered at p
■ The sampling distribution follows the Normal model:
○ What does the sampling distribution tell us? What is its significance?
■ The sampling distribution allows us to make statements about where we
think the corresponding population parameter is and how precise these
statements are likely to be.
■ Sample statistics are random variables themselves
● Sample proportion (for categorical data)
find more resources at oneclass.com
find more resources at oneclass.com

● Sample mean (for quantitative data)
● They have a probability distribution, mean, standard deviation,
etc.
○ Mean and Standard Deviation
■ Sampling Distribution for Proportions
● Mean = p
●
●
●
○ Let’s go ak to our E. o Eolutio
■ The Normal Model for Evolution
■ Given: Population: p = 0.43, n = 1007.
■ Sampling Distribution:
● Mean = 0.43
● “tadard deiatio = σṕ) = √Ϭ.ϰϯϬ.ϱϳ
ϭϬϬϳ =Ϭ.Ϭϭϱϲ
○ Assumptions and Conditions
■ Most models are useful only when specific assumptions are true.
■ There are two assumptions in the case of the model for the distribution
of sample proportions:
● The Independence Assumption: The sampled values must be
independent of each other.
find more resources at oneclass.com
find more resources at oneclass.com
Document Summary
Covers: 10/23, 10/25, 10/27, 10/30, 11/1, 11/3 ,11/6, 11/8, 11/10 (9 lectures, weeks 9,10, & The harris poll found that of 889 u. s. adults, 40% said they believe in ghosts. Cbs news found that of 808 u. s. adults, 48% said they believe in ghosts. Let"s de(cid:374)ote the populatio(cid:374) proportio(cid:374) p, and the sample proportion p^ The central limit theorem (clt) for sample proportions. Rather than showing real repeated samples, imagine what would happen if we were to actually draw many samples and look at their proportions. The histogram we would make would show us all the proportions from all possi(cid:271)le sa(cid:373)ples this is called the sampling distribution of the proportions. According to a gallup poll, 43% believe in evolution. If many surveys were done of 1007 americans, we could calculate the sample proportion for each. The histogram shows the distribution of a simulation of 2000 sample proportions.