7126 Chapter Notes - Chapter MODULE 4B: Venn Diagram, Explained Variation, Coefficient Of Determination

20 Jun 2018
School
Department
Course
Professor

MODULE 4B: MLR2
Semi-partial correlation
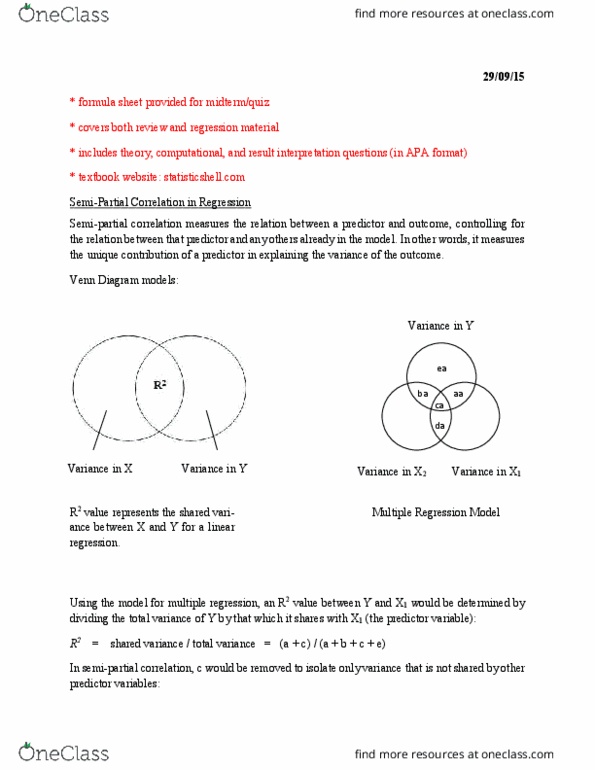
- Venn diagrams depict variance and shared variance
o
oA + b + c + d = variance in DV
oA + b + c = R (Variance in the DV explained by IV1 and IV2)
oA + c = uniquely explained variance
oB = non-uniquely explained variance
- A and c are semi-partial correlations (sr)
oA = sr between IV1 and DV after controlling for (partialling out) the influence of IV2
oC = sr between IV2 and DV after controlling for (partialling out) the influence of IV1
Semi-partial correlations in MLR
- When interpreting MLR coefficients
oDraw a path diagram or venn diagram
oCompare 0-order ® and semi-partial correltions (sr) for each IV to help understand
relations amongst the IVs and the DV
A semi-partial correlation (sr) will be less than or equal to the correltion ®
If sr equals a r, then the IV independently predicts the DV
To the extent that a sr is less than the r, the IVs explanation of the DV is
shared with other IVs
An IV may have a significant r with the DV, but a non-significant sr. This
indicates that the unique variance explained by the IV may be 0
oCompare the relative importance of the predictrs using betas and/or srs
- Spss provides semi-partial correlations if selected (labelled “part”)
- Square sr to get sr2
- The sr2 indicates the % of variance n the DV which is uniquely explained by an IV
find more resources at oneclass.com
find more resources at oneclass.com

- compare each sr2 with the r2 – do they differ – why?
Semi-partial correlations for MLR in SPSS
-
-
Summary: semi partial correlations (sr)
- In MLR, sr is labelled “part” in the regression coefficients table in SPSS output
- Square these values to obtain sr2, the unique % of DV variance explained by each IV
- Discuss the extent to which the explained variance in the DV is due to unique or shared
contributions of the IVs
find more resources at oneclass.com
find more resources at oneclass.com

-
Residual analysis
-
- Assumptions about residuals
oSometimes positive, sometimes negative, but on average 0
oError is random
oNormally distributed about 0
find more resources at oneclass.com
find more resources at oneclass.com
Document Summary
When interpreting mlr coefficients: draw a path diagram or venn diagram, compare 0-order and semi-partial correltions (sr) for each iv to help understand relations amongst the ivs and the dv. A semi-partial correlation (sr) will be less than or equal to the correltion . If sr equals a r, then the iv independently predicts the dv. To the extent that a sr is less than the r, the ivs explanation of the dv is shared with other ivs. An iv may have a significant r with the dv, but a non-significant sr. This indicates that the unique variance explained by the iv may be 0: compare the relative importance of the predictrs using betas and/or srs. Spss provides semi-partial correlations if selected (labelled part ) In mlr, sr is labelled part in the regression coefficients table in spss output. Square these values to obtain sr2, the unique % of dv variance explained by each iv.