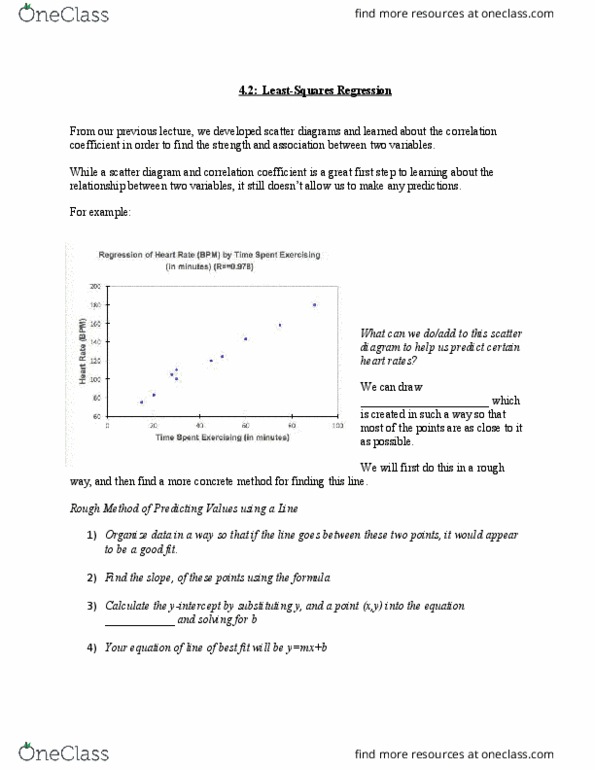
While a scatter diagram and correlation coefficient is a great first step to learning about the relationship between two variables, it still doesn"t allow us to make any predictions. We can draw a line of best fit which is created in such a way so that most of the points are as close to it as possible. We will first do this in a rough way, and then find a more concrete method for finding this line. Example 1: using the data that created the scatter diagram, create a line of best fit. m = 180 - 75. 90 - 15 m = 1. 4 y = mx +b. Equation of the line is : y = 1. 4x + 54. Now that we have this equation, we can substitute in some time in minutes a person exercises and we will receive a predicted heart rate for that amount of time.