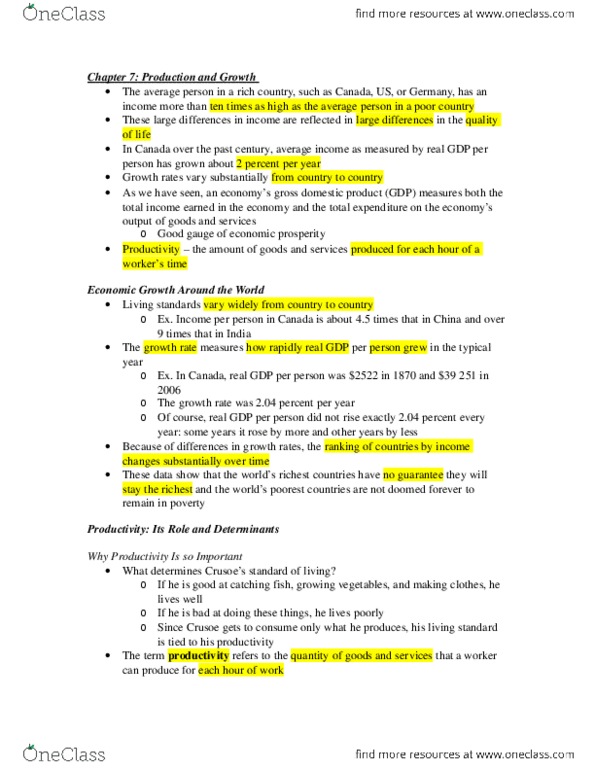
ECON 1002 Chapter Notes - Chapter 7: High Standard Manufacturing Company, Human Capital Flight, Diminishing Returns

Get access


Related Documents

Related Questions
Using the average yearly growth rates provided in the table below, calculate the index of real GDP and population growth between 2000 and 2010 for China, Canada, and Zimbabwe. Assume that the value of this index is equal to 100 for the year 2000. Calculate the growth rates for these three countries using the compounding growth function.
Note: To calculate the growth in GDP, use the compounding growth function: p0 x (1+ r)t where p0 is the original value of 100, r is the growth rate (for example, a growth rate of 2.1% (Canadian GDP) has a decimal equivalent of r = 0.021), and t is the number of years of growth (10 years in this case). An original value of 100 is used as the index to incorporate the weight of any changes.
| Average Growth Rate (2000-2009) of | |||
| GDP | Population | Per capita GDP |
|
| High-income countries | |||
| United States | 2.0 | 1.1 | 0.9 |
| Canada | 2.1 | 1.0 | 1.1 |
| Japan | 1.1 | 0.2 | 0.9 |
| France | 1.5 | 0.5 | 1.0 |
| Low-income countries | |||
| China | 10.9 | 0.8 | 10.1 |
| India | 7.9 | 1.6 | 6.3 |
| Ethiopia | 7.5 | 2.8 | 4.7 |
| Burundi | 2.7 | 2.0 | 0.7 |
| Haiti | 0.7 | 1.8 | -1.1 |
| West Bank/Gaza | -0.9 | 3.8 | -4.7 |
| Zimbabwe | -7.5 | 0.9 | -8.4 |
Instructions: Enter your answers rounded to two decimal places.
China: GDP increased from 100 to ______, and population increased from 100 to _______.
Canada: GDP increased from 100 to ______, and population increased from 100 to ________.
Zimbabwe: GDP decreased from 100 to ______, and population increased from 100 to _______.

In recent years, the BRIC (Brazil, Russia, India and China) countries have received much attention due to their growing importance in the world economy. Now that you are equipped with knowledge about macroeconomic data, you can take a first-hand look at how quickly these countries have been growing, how much inflation they have, and how developed they are when compared to the USA.
| Brazil | Russia | India | China | USA | |
| Nominal GDP in 2013 (local currency, Million) | 4,844,815 | 66,755,300 | 113,550,735 | 56,884,521 | 16,768,100 |
| Nominal GDP in 2000 (local currency, Million) | 1,179,482 | 7,305,600 | 21,774,127 | 9,921,455 | 10,284,800 |
| Price Level in 2013 (index 2010=100) | 124.12 | 121.63 | 132 | 111.1 | 106.8 |
| Price Level in 2000 (index 2010=100) | 51.4 | 30.75 | 54.2 | 81 | 79 |
| Population in 2013 (in Million) | 200.4 | 143.5 | 1,252 | 1,357 | 316.1 |
| Population in 2000 (in Million) | 174.5 | 146.6 | 1,042 | 1,263 | 282.2 |
| Dollar/Local Currency Exchange rate 2013 | 1/2.4 | 1/32.6 | 1/62.18 | 1/6.07 | 1 |
| PPP Conversion Factor 2013 | 1/1.9 | 1/19.47 | 1/18.24 | 1/3.36 | 1 |
The PPP conversion factor is the price in US dollars of a basket of goods (chosen by the World Bank) in the USA divided by the price in local currency of a comparable basket in that country.
For each of the BRIC countries and the US, over the period 2000-2013, answer the following:
1.What was the average annual inflation rate?
2.What was the average annual growth rate of population?
3.What was the average annual growth rate of real GDP?
4.What was the average annual growth rate of real GDP per capita?
5.For each of the BRIC countries, in the year 2013, how did real income per capita compare to that in the US? (To make this comparison, report real GDP per capita for each country as a percentage of the US.) Report two answers, one based on market exchange rates and one adjusted for differences in purchasing power.
