COMM 217 Chapter 2: CHAPTER 2 - Graphs, Charts & Tables.docx

25 Feb 2015
School
Department
Course
Professor
Document Summary
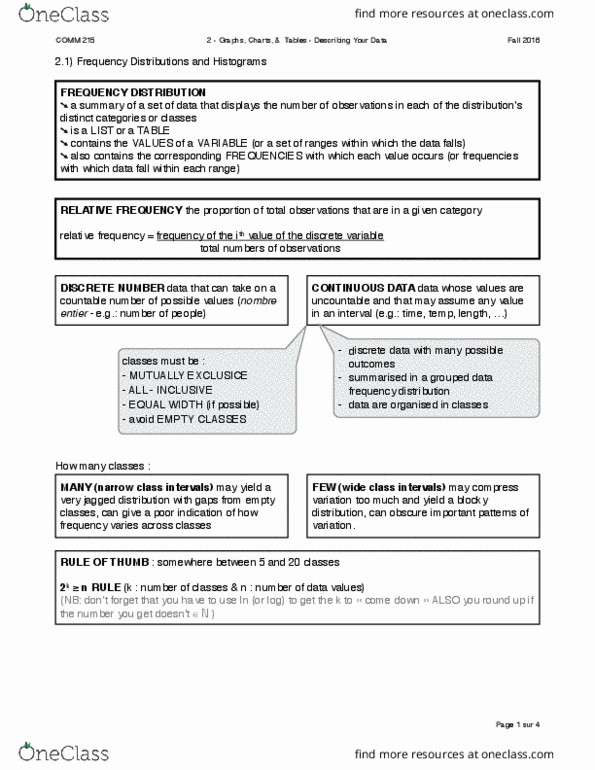
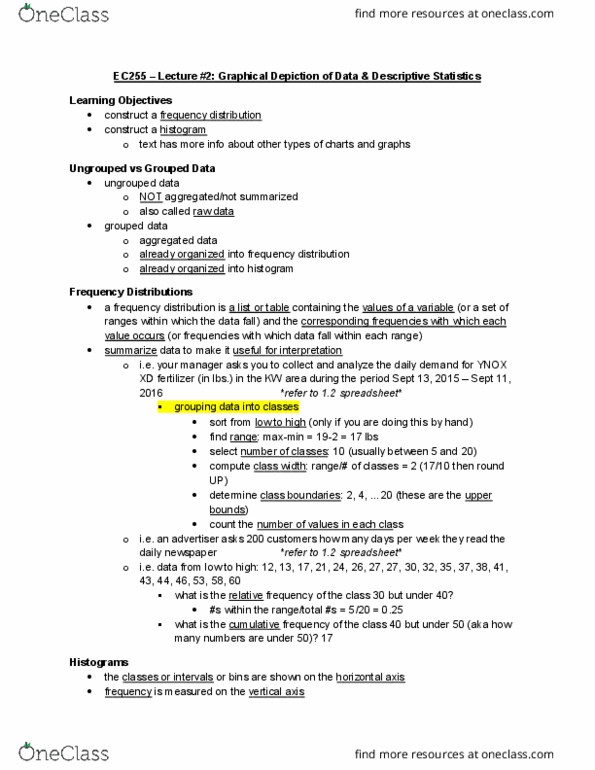
Chapter 2: graphs, charts, & tables describing your. A summary of a set of data that displays the number of observations in each of the distribution"s distinct categories or classes. Example: an advertiser asks 200 customers how many days per week they read the newspaper. The proportion of total observations that in a given category. Step 2: count the number of occurrences at each value. Step 3: determine the class boundaries for each class (the upper & lower values of each class) Step 4: determine the class boundaries for each class. Many (narrow class intervals: may yield a very jagged distribution with gaps from empty classes, can give a poor indication of how frequency varies across classes y c n e u q e r. Few (wide class intervals: may compress variation too much and yield blocky distribution, can obscure important patterns of variation. Rule of thumb: between 5 and 20 classes.