ECON 208 Chapter Notes - Chapter 3: Ceteris Paribus, Equation, Demand Curve

13 Jul 2012
School
Department
Course
Professor


27
ECON 208 Full Course Notes
Verified Note
27 documents
Document Summary
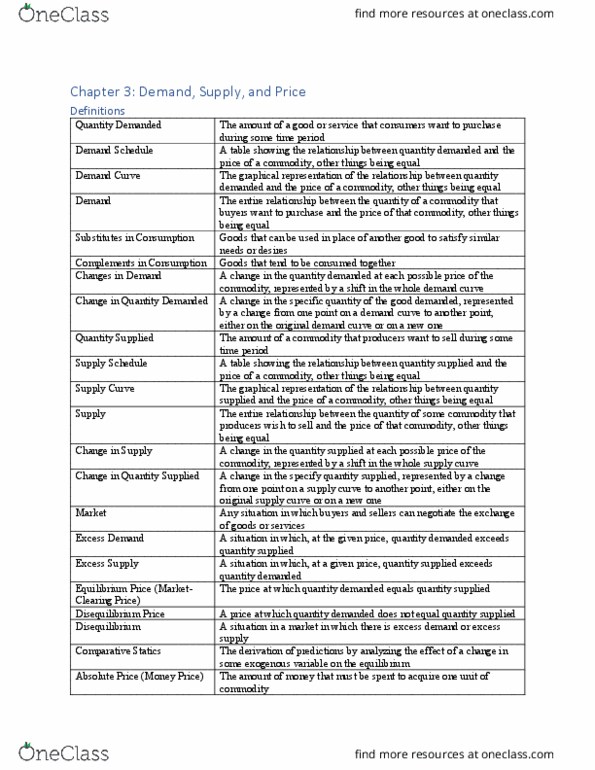
Functional relationships: represented in a verbal statement, in a numerical schedule/table, a mathematical equation, or in a graph. What is a function: one equation with one or two variables. C is consumption and y is a household"s annual income. This expresses the dependence of consumption on annual income. This is said c is a function of y . Y would be exogenous and c would be the endogenous variable because we explain consumption using the data we have on y. If a graph is a straight line, it is a linear relationship, and if it is anything else (function, curve, scatterplot) it is a not linear relationship. Equilibrium- when quantity demanded is equal to quantity supplied (no surplus/deficit) Quantity demanded: the total amount that consumers desire to purchase in some time period. Quantity bough (or exchanged) refers to actual purchases. Quantity demanded in a flow, as opposed to a stock.