MGCR 271 Chapter Notes - Chapter 2: Dependent And Independent Variables, Scatter Plot

6 Aug 2017
School
Department
Course
Professor
Document Summary
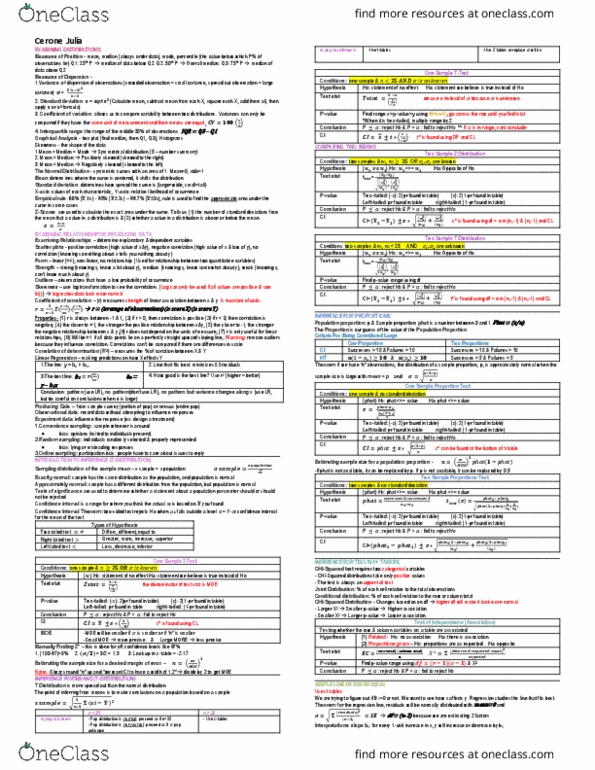
The proper analysis depends on whether the variables are categorical or quantitative and on whether one is an explanatory variable and the other a response variable. When you have a categorical explanatory variable and a quantitative response variable, tools can compare distributions of the response for the different categories of explanatory variable. These tools include: side-by-side boxplots, stemplots, histograms (compare medians or means). If both variables are categorical, there is no satisfactory graph (though bar graphs can help). Recognize whether each variable is quantitative or categorical. Identify the explanatory and response variables in situations where one variable explains or i(cid:374) uences another. Make a scatterplot to display the relationship between two quantitative variables. Place the explanatory variable (if any) on the horizontal scale of the plot. Add a categorical variable to a scatterplot by using a different plotting symbol or color. Describe the form, direction, and strength of the overall pattern of a scatterplot.