PSYC 202 Chapter Notes - Chapter 4: Bar Chart, Pie Chart, Contingency Table

15 Jun 2018
School
Department
Course
Professor

WEEK 4 VIDEO NOTES
Categorical data:
Categorical data
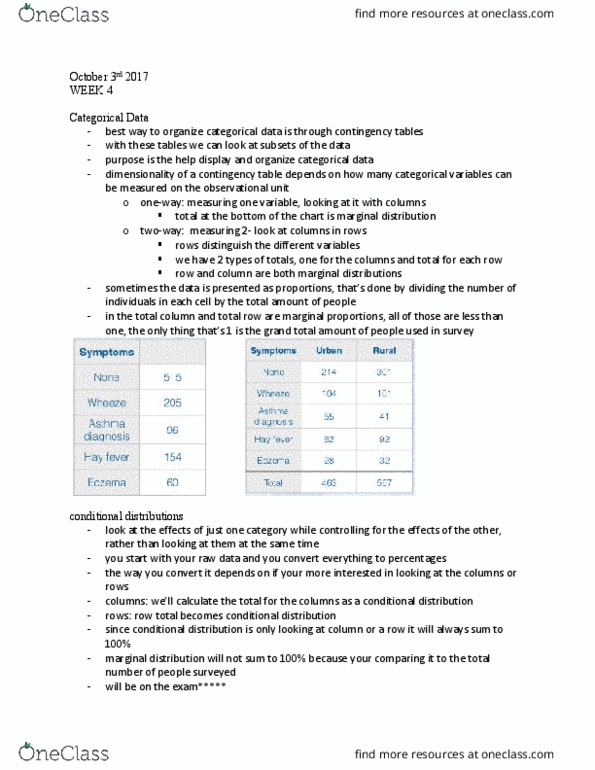
- Seen in contingency tables
o One way
▪ Columns
o Two way
▪ Columns and rows
o Summarize the frequency of observations that fall into one or more categories
- Conditional distributions—give the proportion for just a subset of the table (e.g.
percentage within a row, or within a column so the row or column total is 100%)
o Proportions or percentages
o Using either column variable or row variable
▪ Calculate either total for row or column
▪ Then divide the column or row by the total
o Marginal distribution – dividing by the total in the whole table
▪ Give the frequency or proportion for all levels in the row or column
Bar charts:
- Alternative way to show the same info as contingency tables
- Used for one way information
- Gaps between bars
Grouped bar charts
- Used for two way information
Histograms
- Plot of sorted and binned data
- No gaps between bars because the data is continuous
- Cumulative histograms
o Plot cumulative frequency
▪ Sum frequency as u go from the left to right
o Easy to compare multiple groups
Scatterplots
-
- Show the relationship between two numerical variables
- Grouped boxed plots
Document Summary
Seen in contingency tables: one way, columns, two way, columns and rows, summarize the frequency of observations that fall into one or more categories. Alternative way to show the same info as contingency tables. No gaps between bars because the data is continuous. Cumulative histograms: plot cumulative frequency, sum frequency as u go from the left to right, easy to compare multiple groups. Show the relationship between two numerical variables. Grouped boxed plots: looking at numerical and categorical variables. Causation between a factor and measured variable. One way categorical contingency table, bar chart, pie chart. Two way categorical by categorical contingency table, grouped bar chart. Two way numerical by categorical cumulative histogram, grouped box plot. Two way numerical by numerical scatter plot, line plot. Three way numerical by numerical by categorical scatterplot, line plot with symbols identifying categories. Be careful of the area for bar charts. Order categorical levels in a logical fashion. Show sample size when using relative frequency.