PSYC 202 Chapter Notes - Chapter 9: Multivariate Normal Distribution, Null Hypothesis, Sampling Distribution

15 Jun 2018
School
Department
Course
Professor

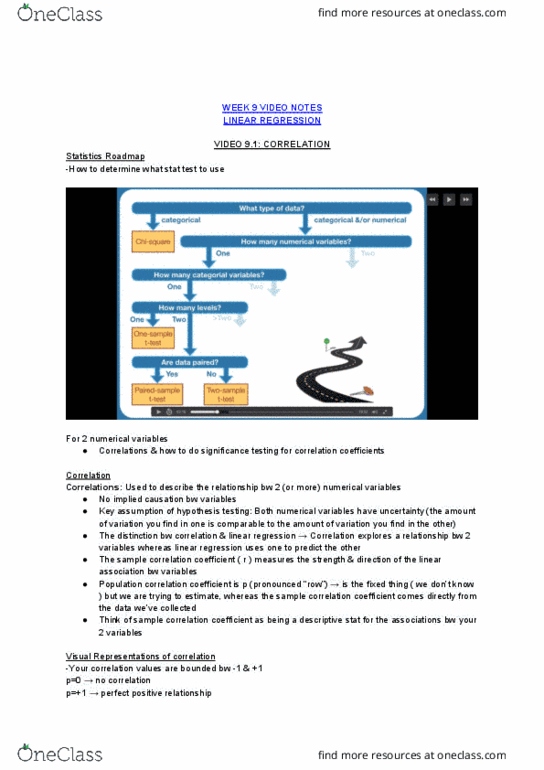
WEEK 9 VIDEO NOTES
Type of data
Correlation
- Describe the relationship between two or more numerical variables
- No implied causation between the variables
- Both variables have uncertainty
o Amount of variation in one is comparable to amount of variation in other
- Not used for prediction
- Linear regression is uses one variable to predict the other
- Sample correlation coefficient ( r) measures the strength and direction of the linear
association between the variables
- Population correlation coefficient is ρ (rho)
- Sample correlation coefficient comes from the data
- Correlation = 1→ perfect positive correlation
- Correlation = -1 → perfect negative coefficient
-

-
Significance testing
- Sampling units are drawn from a bivariate normal distribution
o
o
- Step 1
o State the null and alternative hypothesis
- Step 2
o Establish the null distribution and test statistic

- Step 3
o Conduct the statistical test
- Step 4
o Draw conclusions
- Sampling distribution of the sample correlation coefficient ( r) follows a t-distribution
-
-
▪ Observed t score → r divided by standard error of r
- Typically 2 tailed test
- To>tc → reject the null hypothesis
- Cant use line because it is used for linear regression
- Use ellip – oval that shows distribution
Correlation = relationship
Linear regression = predicting
Video 2
Linear regression
- Predict the value of one numerical variable form other numerical variables
- Can imply causation
- Independent or predictor variable on x axis
- Dependent or response variable on y axis
- Variation in y axis only
- X locations are fixed or predetermined
- Assume there is a probability distribution that goes up and down y axis
Document Summary
Describe the relationship between two or more numerical variables. Both variables have uncertainty: amount of variation in one is comparable to amount of variation in other. Linear regression is uses one variable to predict the other. Sample correlation coefficient ( r) measures the strength and direction of the linear association between the variables. Sample correlation coefficient comes from the data. Sampling units are drawn from a bivariate normal distribution. Step 1: state the null and alternative hypothesis. Step 2: establish the null distribution and test statistic. Step 3: conduct the statistical test. Sampling distribution of the sample correlation coefficient ( r) follows a t-distribution: observed t score r divided by standard error of r. Cant use line because it is used for linear regression. Use ellip oval that shows distribution. Predict the value of one numerical variable form other numerical variables. Dependent or response variable on y axis.