MKT 500 Chapter Notes - Chapter 13: Null Hypothesis, Bar Chart, Contingency Table

12 Nov 2012
School
Department
Course
Professor

Document Summary
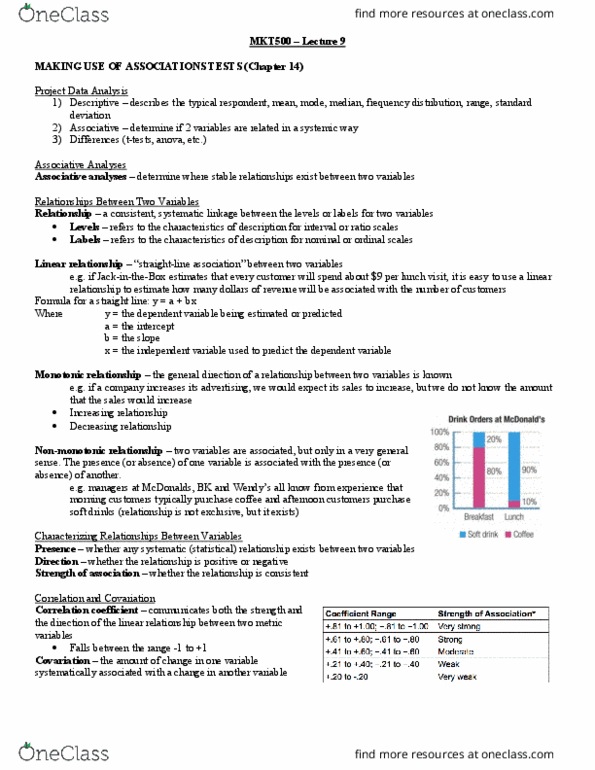
9 chapter 13 relationships between variables. Relationship consistent and systematic linkage between the levels or labels for two variables. Boolean relationship one in which the presence of one"s variable"s label is systematically related to the presence of another variable"s label. Characterizing a boolean relationship with a graph: stacked bar graph two variables are shown simultaneously on the same bar graph. Each bar in the stacked bar chart stands for 100% and it is divided proportionately by the amount of relationship that one variable shares with the other variable. Cross-tabulation analysis analytical technique that assesses the statistical significance of. Expected frequency = (cell column total*cell row total)/grand total: chi-squared = sum of (observedi expectedi)2/expectedi, how to interpret a significant cross-tabulation finding: Set up cross-tab table with observed frequencies. Determine critical chi-square using (#rows 1)*(#columns 1) = degrees of freedom (using this number, find it in the critical value table) Evaluate whether or not the null hypothesis of no relationship is supported.