QMS 230 Chapter Notes - Chapter 2: Pie Chart, Certified General Accountant, Bar Chart

8 Dec 2011
School
Department
Course
Professor
Document Summary
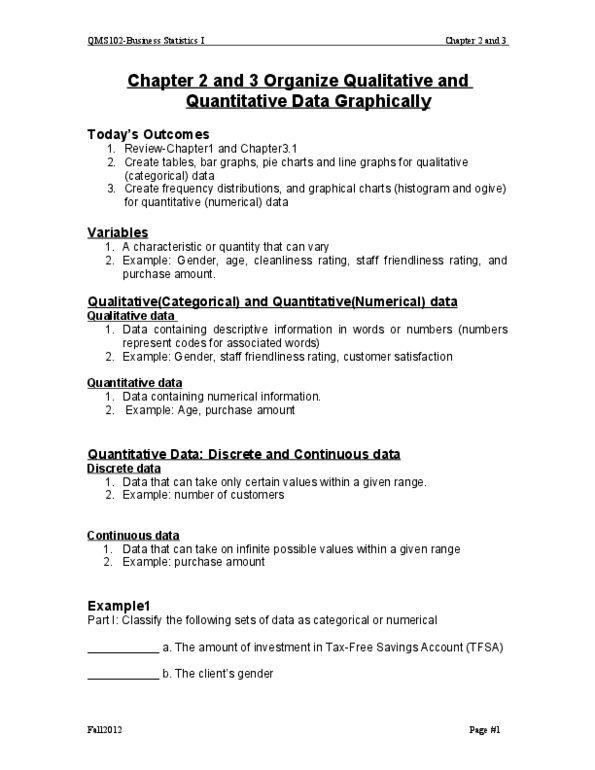
Chapter 2 presenting data in tables and charts. Today"s outcomes: review-chapter1 and chapter2. 1 and 2. 2, create tables, bar graphs, pie charts and line graphs for qualitative (categorical) data, create frequency distributions, and graphical charts (histogram and ogive) for quantitative (numerical) data. Variables: a characteristic or quantity that can vary, example: gender, age, cleanliness rating, staff friendliness rating, and purchase amount. Qualitative data: data containing descriptive information in words or numbers (numbers represent codes for associated words, example: gender, staff friendliness rating, customer satisfaction. Discrete data: data that can take only certain values within a given range, example: number of customers. Continuous data: data that can take on infinite possible values within a given range, example: purchase amount. Part i: classify the following sets of data as categorical or numerical. The amount of investment in tax-free savings account (tfsa) _____n_____ e. the number of customers in the ryersonbank. Part ii: classify the following sets of data as continuous or discrete.