HSCI 330 Chapter Notes - Chapter Week 10: Confidence Interval, Normal Distribution, Statistical Parameter

24 Jan 2018
School
Department
Course
Professor
Document Summary
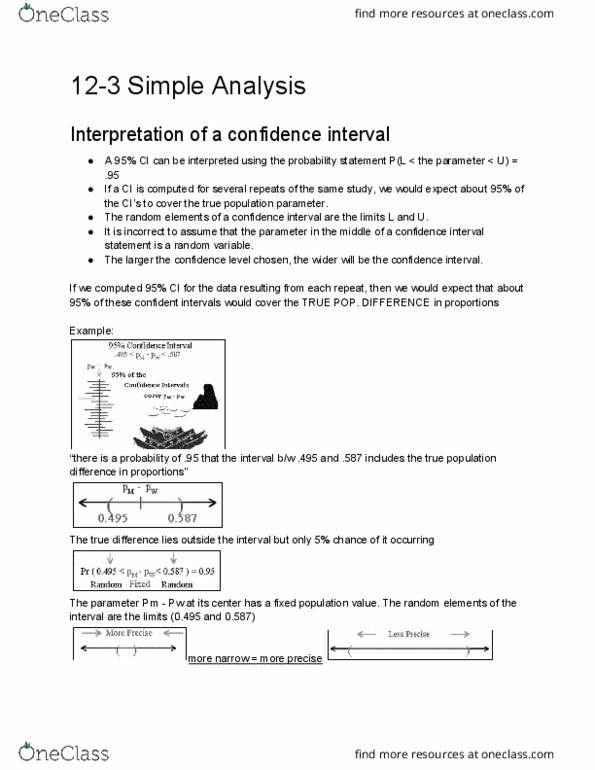
A confidence interval (ci) provides two numbers l and u between which the population parameter lies with a specified level of confidence. The sta(cid:374)da(cid:396)d e(cid:396)(cid:396)o(cid:396) of the diffe(cid:396)e(cid:374)ce is the s(cid:395)(cid:396)t of the su(cid:373) of the va(cid:396)ia(cid:374)ces of the p(cid:396)opo(cid:396)tio(cid:374)s . The value 1. 96 is the 97. 5 percent point of the standard normal distribution because the area between -1. 96 and +1. 96 under the normal curve is . 95, corresponding to the 95% confidence level we specified. The 95% confidence interval for the difference in proportions or men and women who died on the titanic is given by the range of values between 0. 495 and 0. 587. 1. 96 * the estimated standard error of the estimated difference. Estimated standard error: the sqrt of the sum of the estimated variances of each proportion. There is a probability of 95% that the interval between 0. 495 and 0. 587 includes the true population difference in proportions.