STAT151 Chapter 2: Stats Chapter 2 Displaying and Describing Categorical Data

10 Feb 2017
School
Department
Course
Professor


4
STAT151 Full Course Notes
Verified Note
4 documents
Document Summary
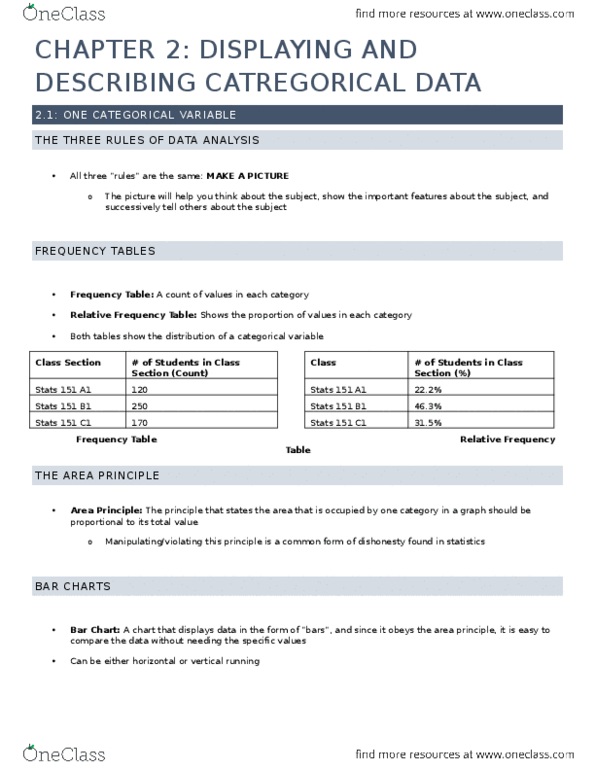
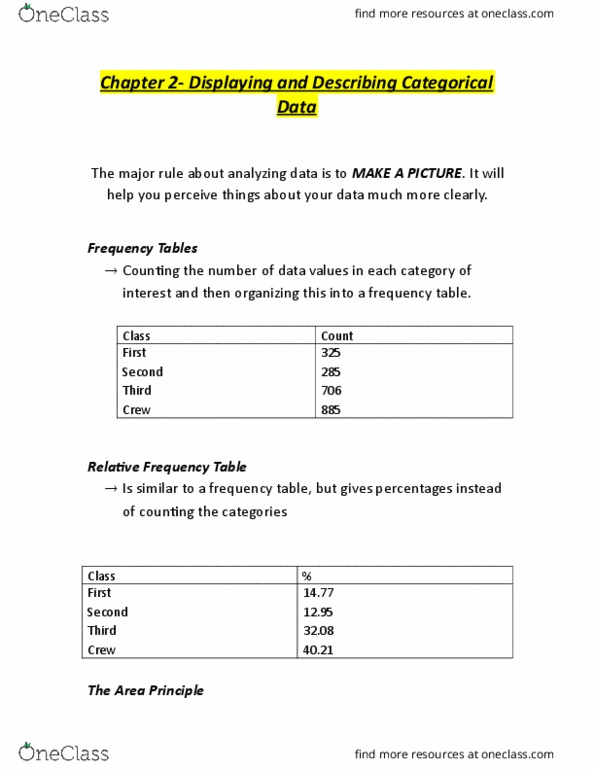
Stats chapter 2 displaying and describing categorical data. Introduction: problem with a data table, ca(cid:374)"t see (cid:449)hat"s goi(cid:374)g o(cid:374) Three rules of tada analysis: make a picture, display of data so you can think about relationships, make a picture, display will show important features, make a picture, so you can tell about your data. Then multiply by 100 to get a percentage: both cases show distribution of a categorical variable because they name the possible categories and tell how frequently each occurs. Pie charts: show the whole group of cases as a circle. Independent variable: when in a contingency table, the distribution of one variable is the same for all categories of another. Comparing conditional distributions of one variable across categories of another tells us about the association between variables. Be careful not to use them with quantitative data: marginal distribution. In a contingency table, the distribution of either variable alone.