SOCI 311 Chapter 3: SOCI 311 LAB 3

18 Mar 2018
School
Department
Course
Professor
Document Summary
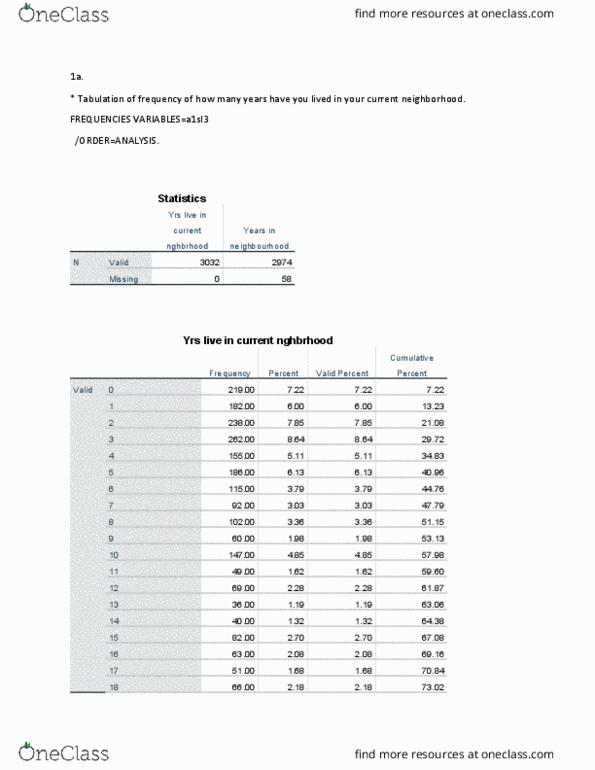
*show how how to get sub analysis, in this case, men and women. Value labels filter_$ 0 "not selected" 1 "selected". Frequency distribution for material status for men and women. 0 a1page_m m1 age computed by subtracting date of birth from. *recodes age to drop young ages and missing. Recode a1page_m (25 thru 34=1)(35 thru 44=2)(45 thru 54=3)(55 thru 64=4)(65 thru 74=5) (else=sysmis) Frequencies variables= a1page_m myagegroup myagegroup my age class. 47. 72% of area under the curve and 3 standard deviations from the mean will always take up 49. 87% of the area under the curve. It will always be like this refers to the percentage of the area under the normal curve indicated by standard deviations from the mean: x= below 20. 20-31/5= -2. 2 column b question =0. 4861 convert to percentage = 48. 61% 40-31/5=1. 8 column b question = 0. 4641 convert to percentage = 46. 61% 25-31/5=-1. 2 column b question = 0. 3849 convert to percentage = 38. 49%