ECON 1050 Chapter 11: Economics-1 (1) (dragged) 4

17 Sep 2016
School
Department
Course
Professor
Document Summary
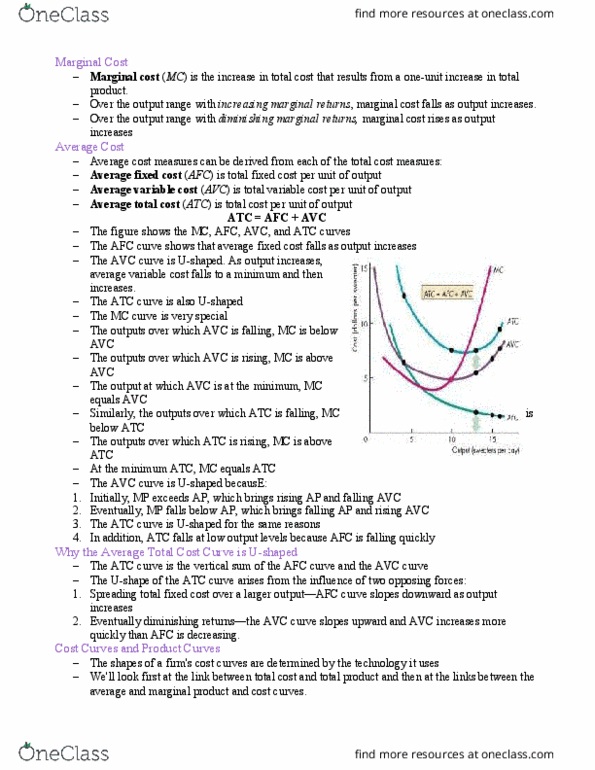
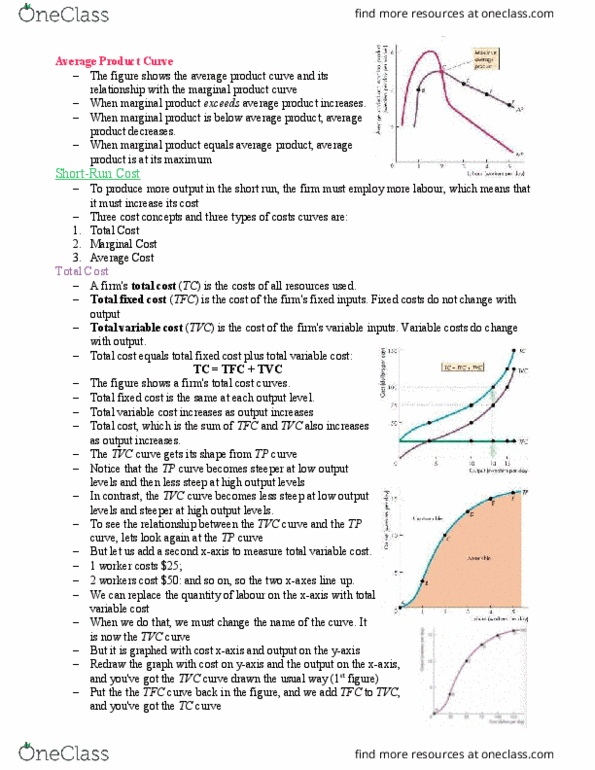
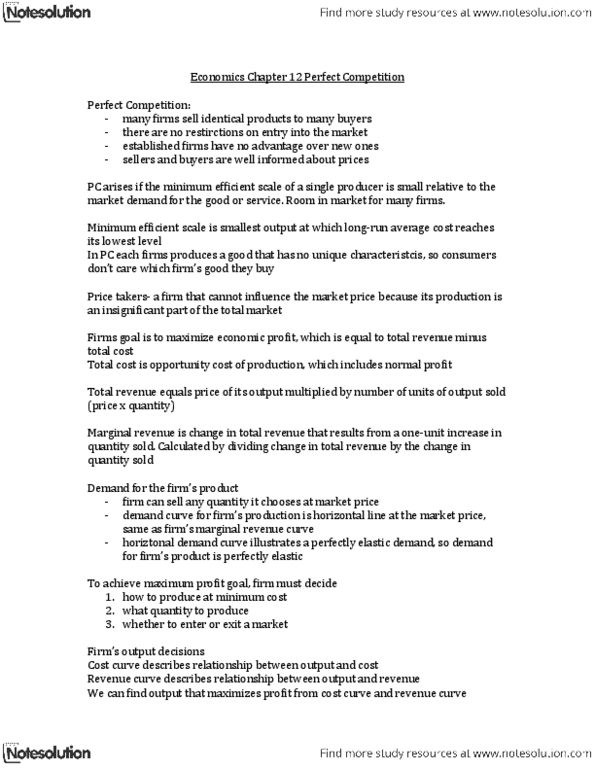
The figure shows when output is plotted against labor, the curve is the tp curve. When output is plotted against variable cost, the curve is the. The shapes of a firm"s cost curves are determined by the technology is uses: Mc is at its minimum at the same output level at which mp is at its maximum. When mp is rising, mc is falling. Avc is at its minimum at the same output level at which ap is at its maximum. When ap is rising, avc is falling. The position of a firm"s cost curves depend on two factors: technology, prices of factors of production. Technological change influences both the product curves and the total cost curves. An increase in productivity shifts the product curves upward and the cost curves downward. If a technological advance results in the firm using more capital and less labour, fixed costs increase and variable costs decrease.