ECON 2560 Chapter Notes - Chapter 16: Capital Structure, Tax Shield, Dividend Yield
30 views10 pages

24 Jul 2014
School
Department
Course
Professor
Document Summary
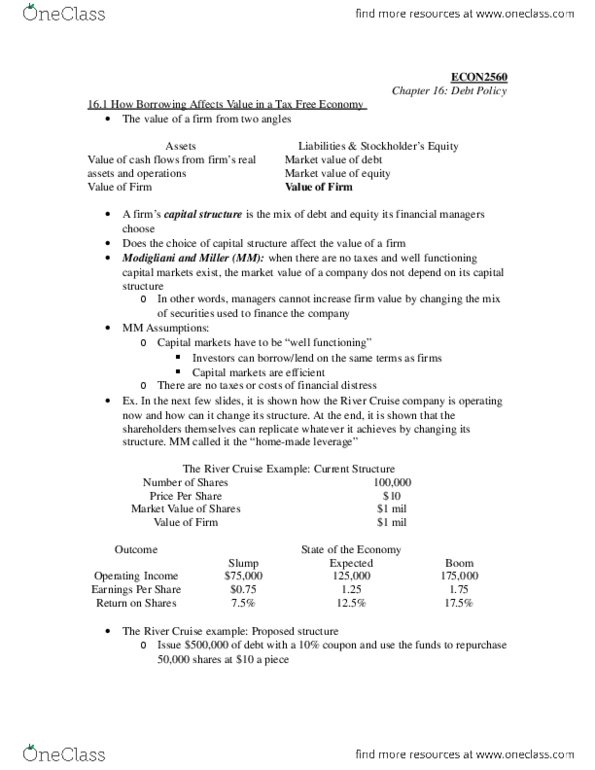
Mm"s prosposition i: how borrowing affects risk and return o, restructuring does not affect operating incomes, regardless of the state of the economy, debt financing doesn"t affect the oeprating risk or the business riskk of the firm. 1. 25/10 = . 125: this is the cost of equity capital, requity and also r assets, overall return = (rdebt * d/v) + (requity * e/v) o o. If the debt is permanent, then the firm can look forward to an annual savings of in perpetuity: their present value is = 17500/. 1 o o, how interest tax shields contribute to the value of. Shareholders equity: in a no tax world, mm"s proposition i states that the value of the firm is unaffected by capital structure, mm also modified proposition i to recognize corporate taxes. Value of levered firm = value if all equity financed + present value of tax shield: in the special case of permanent debt.
Get access
Grade+20% off
$8 USD/m$10 USD/m
Billed $96 USD annually

Homework Help
Study Guides
Textbook Solutions
Class Notes
Textbook Notes
Booster Class
40 Verified Answers
Class+
$8 USD/m
Billed $96 USD annually

Homework Help
Study Guides
Textbook Solutions
Class Notes
Textbook Notes
Booster Class
30 Verified Answers
Related Documents

Related Questions
| d. TTC recently introduced a new line of products that has been wildly successful. On the basis of this | ||||||||||||||||||||||||||||||||||||||||||||||||||||||||||||
| success and anticipated future success, the following free cash flows were projected: | ||||||||||||||||||||||||||||||||||||||||||||||||||||||||||||
| Year | FCF (in millions) | |||||||||||||||||||||||||||||||||||||||||||||||||||||||||||
| 1 | $5.5 | |||||||||||||||||||||||||||||||||||||||||||||||||||||||||||
| 2 | $12.1 | |||||||||||||||||||||||||||||||||||||||||||||||||||||||||||
| 3 | $23.8 | |||||||||||||||||||||||||||||||||||||||||||||||||||||||||||
| 4 | $44.1 | |||||||||||||||||||||||||||||||||||||||||||||||||||||||||||
| 5 | $69.0 | |||||||||||||||||||||||||||||||||||||||||||||||||||||||||||
| 6 | $88.8 | |||||||||||||||||||||||||||||||||||||||||||||||||||||||||||
| 7 | $107.5 | |||||||||||||||||||||||||||||||||||||||||||||||||||||||||||
| 8 | $128.9 | |||||||||||||||||||||||||||||||||||||||||||||||||||||||||||
| 9 | $147.1 | |||||||||||||||||||||||||||||||||||||||||||||||||||||||||||
| 10 | $161.3 | |||||||||||||||||||||||||||||||||||||||||||||||||||||||||||
| After the 10th year, TTC's financial planners anticipate that its free cash flow will grow at a constant rate | ||||||||||||||||||||||||||||||||||||||||||||||||||||||||||||
| of 6%. Also, the firm concluded that the new product caused the WACC to fall to 9%. The market value | ||||||||||||||||||||||||||||||||||||||||||||||||||||||||||||
| of TTC's debt is $1,200 million, it uses no preferred stock, and there are 20 million shares of common | ||||||||||||||||||||||||||||||||||||||||||||||||||||||||||||
| stock outstanding. Use the corporate valuation model approach to value the stock. | ||||||||||||||||||||||||||||||||||||||||||||||||||||||||||||
| INPUT DATA: (Dollars in Millions) | ||||||||||||||||||||||||||||||||||||||||||||||||||||||||||||
| WACC | 9% | |||||||||||||||||||||||||||||||||||||||||||||||||||||||||||
| gn | 6% | |||||||||||||||||||||||||||||||||||||||||||||||||||||||||||
| Millions of shares | 20 | |||||||||||||||||||||||||||||||||||||||||||||||||||||||||||
| MV of debt | $1,200 | |||||||||||||||||||||||||||||||||||||||||||||||||||||||||||
|
|
||||||||||||||||||||||||||||||||||||||||||||||||||||||||||||
| Year | ||||||||||||||||||||||||||||||||||||||||||||||||||||||||||||
| 0 | 1 | 2 | 3 | 4 | 5 | 6 | 7 | 8 | 9 | 10 | 11 | |||||||||||||||||||||||||||||||||||||||||||||||||
| FCF's | $5.5 | $12.1 | $23.8 | $44.1 | $69.0 | $88.8 | $107.5 | $128.9 | $147.1 | $161.3 | ||||||||||||||||||||||||||||||||||||||||||||||||||
| PV of FCF's |
|
|||||||||||||||||||||||||||||||||||||||||||||||||||||||||||
| PV of FCF1-10 = | ||||||||||||||||||||||||||||||||||||||||||||||||||||||||||||
| HV at Year 10 of FCF after Year 10 = FCF11/(WACC â gn): | ||||||||||||||||||||||||||||||||||||||||||||||||||||||||||||
| PV of HV at Year 0 = HV/(1+WACC)10: | ||||||||||||||||||||||||||||||||||||||||||||||||||||||||||||
| Sum = Value of the Total Corporation | ||||||||||||||||||||||||||||||||||||||||||||||||||||||||||||
| Less: MV of Debt and Preferred | ||||||||||||||||||||||||||||||||||||||||||||||||||||||||||||
| Value of Common Equity | ||||||||||||||||||||||||||||||||||||||||||||||||||||||||||||
| Number of Shares (in Millions) to Divide By: | ||||||||||||||||||||||||||||||||||||||||||||||||||||||||||||
| Value per Share = Value of Common Equity/No. Shares: | versus | using the discounted | ||||||||||||||||||||||||||||||||||||||||||||||||||||||||||
| dividend model | ||||||||||||||||||||||||||||||||||||||||||||||||||||||||||||
| The price as estimated by the corporate valuation method differs from the discounted dividends method because | ||||||||||||||||||||||||||||||||||||||||||||||||||||||||||||
| different assumptions are built into the two situations. If we had projected financial statements, found both | ||||||||||||||||||||||||||||||||||||||||||||||||||||||||||||
| dividends and free cash flow from those projected statements, and applied the two methods, then the | ||||||||||||||||||||||||||||||||||||||||||||||||||||||||||||
| prices produced would have been identical. As it stands, though, the two prices were based on somewhat | ||||||||||||||||||||||||||||||||||||||||||||||||||||||||||||
| different assumptions, hence different prices were obtained. Note especially that in the FCF model we | ||||||||||||||||||||||||||||||||||||||||||||||||||||||||||||
| assumed a WACC of 9% versus a cost of equity of 10% for the discounted dividend model. That would obviously tend to | ||||||||||||||||||||||||||||||||||||||||||||||||||||||||||||
| raise the price. | ||||||||||||||||||||||||||||||||||||||||||||||||||||||||||||


