PSYC 1010 Chapter Notes - Chapter 2: Frequency Distribution, Histogram, Unimodality

2 Dec 2013
School
Department
Course
Professor
Document Summary
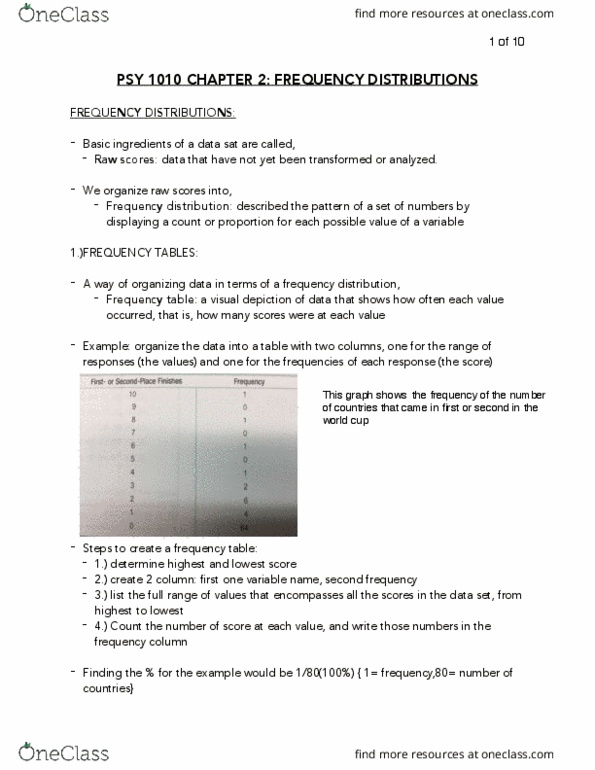
Raw score: a data point that has not yet been transformed or analyzed. Frequency distribution: describes the pattern of a set of numbers by displaying a count or proportion for each possible value of a variable. Frequency table: a visual depiction of data that shows how often each value occurred. Values are listed on one side and the number of individual scores on the other. First thing to do when confronted with a data set is to order the list of numbers so that you can organize them & understand their overall pattern. Steps for creating a frequency table: 1. Determine the highest score and the lowest score: 2. Create two columns: first labelled with the variable & the second labelled frequency: 3. List the full range of values including those values in between that have a frequency of 0: 4. Count the number of scores at each value and write that value as the frequency.