PSYC 1010 Chapter 8: 1010 psy ch8 PDF

29 Jun 2018
School
Department
Course
Professor

of 111
1010 PSY CH8: CONFIDENCE INTERVALS, EFFECT SIZE, AND
STATISTICAL POWER
CONFIDENCE INTERVALS
-Point estimate: a summary statistic from a sample that is just one number used as an
estimate of the population parameter. ( a mean taken from a sample is a point estimate)
INTERVAL ESTIMATES
-Interval estimates: based on a sample statistic and provides a range of plausible values for
the population parameter (used by the media)
EXAMPLE 8.1
-Most annoying phrases “whatever” 47% “you know” 25% anyway” 7% “at the end of the
day” 2% margin error was reported to be +/- 3.2
-Cause 47-3.2=43.8 and 47+3.2=50.02, the interval estimate for “whatever” is 43.8% to
50.2%
-“you know: had received 42%, 5% behind “whatever” and it would have had an interval
estimate of 38.8% to 45.2%. Overlapped with the one for “whatever”(43.8%- 50.2%)
-Confidence interval: an interval estimate based on a sample statistics, it includes the
population mean a certain percentage of the time if the same population is sampled from
repeatedly
-We expect to find the population mean within a certain interval a certain percentage of
the time- usually 95%- when we conduct this same study with the same sample size)
-95% confidence level is most commonly used, indicating the 95% that falls between the two-
tails (e.i.100%-5%=95%)
-

of 211
CALCULATING CONFIDENCE INTERVALS WITH Z DISTRIBUTIONS
EXAMPLE 8.2
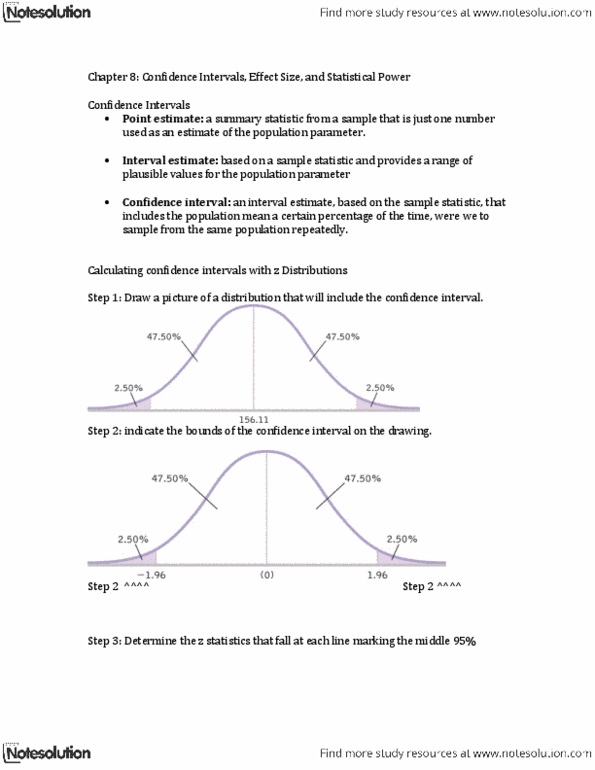
-There are several steps to calculating a confidence interval:
-STEP1: Draw a picture of a distribution that will include the confidence interval
-STEP2: Indicate the bounds of the confidence interval on the drawing
-vertical line from the mean to the top of the curve. 95% confidence interval,we also
draw two small vertical lines to indicate the middle 955 (25% in each tail, for a total
of 5%)
-curve is symmetric, half of the 95% falls above and half falls below the mean.
47.5% in the segments on either side of the mean
-STEP3: Determine the z statistics that fall at each line marking the middle 95%
-Percentage between the mean and each of the z scores is 47.5%. Z table, we find a
z statistic of 1.96. Add the z statistics of -1.96 and 1.96 to the curve
-STEP4: Turn the z statistics back into raw means
-1.) we centre the interval around the sample mean ( use sample mean of 232)
-2.) cause we have a sample mean we use a distribution of mean
-Using this mean and standard error, we calculate the raw mean at each end of the confidence
interval and add them to the curve
M lower : -1.96 (6.36) + 232 = -12.46 + 232 = 219.54
M upper : 1.96 (6.36) + 232 = 12.46 + 232 = 244.46
-95% confidence interval, reported in brackets as is typical,
= 201
√1000
=6.356
=6.356

of 311
- is [219.54,244.46]
-STEP5: Check that the confidence interval makes sense
-Sample mean should fall exactly in the middle of the two ends of the interval
{ 219.54 - 232= -12.46 and 244.46- 232= 12.46}
- We can think of this number, 12.46, as the margin of error
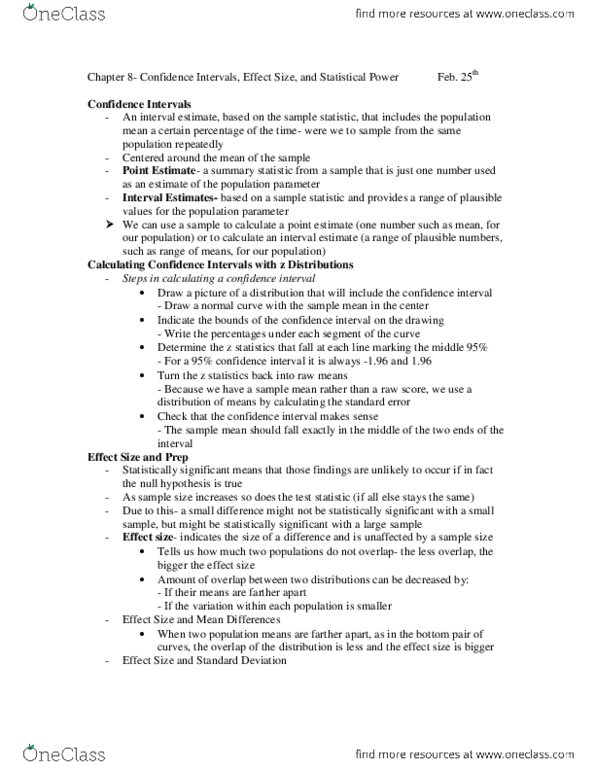
THE EFFECT OF SAMPLE SIZE ON STATISTICAL SIGNIFICANCE
-Example, psychology test scores (GRE) has a mean of 603 and a standard deviation of 101
during 2005-2008. In fictional example 90 graduating had a mean of 622. based on
sample size of 90, we reported the mean and standard error for the distribution of
means as:
µm= µ=603;
The test statistic calculated form these numbers was:
z = (M – μM)
σM
If the sample size is 200?
µm= µ=603
Increasing size to 1000?
µm= µ=603
-Each time we increased the sample size, the standard error decreased and the test statistic
increased
= 101
√90
=10.646
= (622 - 603)
10.646
=1.785
z = (M – μM)
σM
= (622 - 603)
7.142
= 2.66
= 101
√200
= 7.142
= 101
√1000
= 3.194
z = (M – μM)
σM
= (622 - 603)
3.194
= 5.95
Document Summary
1010 psy ch8: confidence intervals, effect size, and. Point estimate: a summary statistic from a sample that is just one number used as an estimate of the population parameter. ( a mean taken from a sample is a point estimate) Interval estimates: based on a sample statistic and provides a range of plausible values for the population parameter (used by the media) Most annoying phrases whatever 47% you know 25% anyway 7% at the end of the day 2% margin error was reported to be +/- 3. 2. Cause 47-3. 2=43. 8 and 47+3. 2=50. 02, the interval estimate for whatever is 43. 8% to. You know: had received 42%, 5% behind whatever and it would have had an interval estimate of 38. 8% to 45. 2%. Con dence interval: an interval estimate based on a sample statistics, it includes the population mean a certain percentage of the time if the same population is sampled from repeatedly.