PSYC 3170 Chapter Notes - Chapter 2: Bar Chart, Line Graph, Scatter Plot

17 Oct 2017
School
Department
Course
Professor
Document Summary
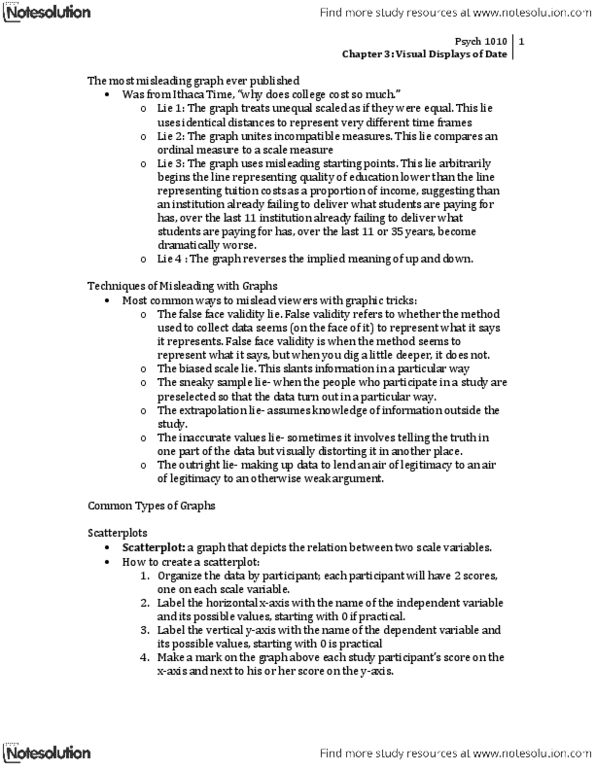
Common types of graphs: scatterplots is a graph that depicts the relation between two scale variables. Organize the data by participant; each participant will have two scores, one on each scale variable. Label the x-axis with the independent variable and its possible values. Label the y-axis with the name of the dependent variable. Make a mark on the graph above each study participants score on the x-axis and next to his or her score on the y-axis. To convert to a range frame simply erase the axes below the minimum score and above the maximum score. Range frame is a scatterplot or related graph indicates the rand of the data on each axis; the lines extend only from the minimum to the maximum scores. Linear relation between variables means that the relation between variables is best described by a straight line.