ECON 101 Chapter 11: Imperfect Competition


This preview shows page 1 of the document.
Unlock all 3 pages and 3 million more documents.


ECON 101 Full Course Notes
Get access


Related Documents
Related Questions
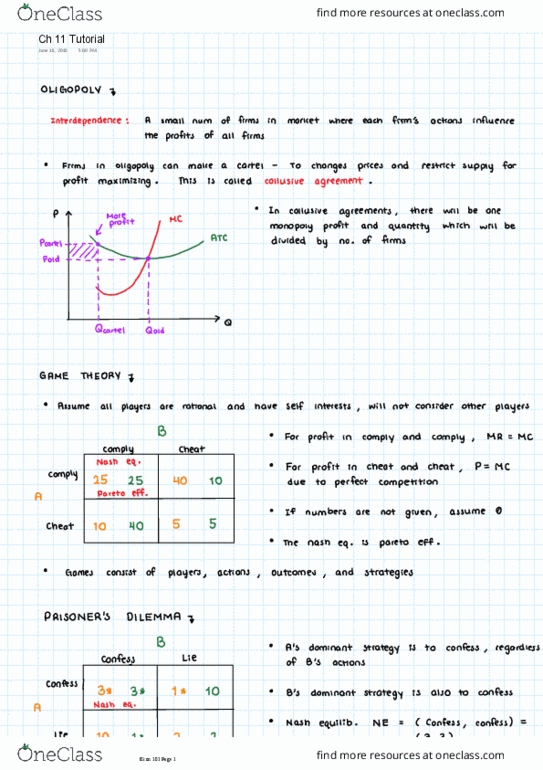
Answer the following questions pertaining to the graph.
1. What is the shape of the AVC and ATC curves? What economic law accounts for this shape? How do you know this?
2. What is the shape of the MC curve? Why does it have this shape? How do you know this?
3. What do you know about the values of AVC and ATC at the points where MC crosses them?
4. Is the AVC higher than the ATC or lower than it? How do you know this?
5. Is the costs in the short run or the long run? How do you know this?
6. Assume the company above is in a Perfect Competition Industry: If the price of the product is $20 that is sold at, what will be the profits and how many will be sold at that price? Can the company raise the price?
7. Again in a Perfect Competition Industry: What would the profit situation be at a price of $30, how much to sell at that price?
8. With the Perfect Competition industry: What would the profit situation be at a price of $10, how much to sell at that price?
9. What are the characteristics of a perfect competition company and industry?
Following is the complete table -
|
Q |
FC |
VC (TC-FC) |
TC |
AFC (FC/Q) |
AVC (VC/Q) |
ATC (TC/Q) |
MC (TCn-TCn-1) |
|
0 |
10 |
0 |
10 |
- |
- |
- |
- |
|
1 |
10 |
10 |
20 |
10 |
10 |
20 |
10 |
|
2 |
10 |
18 |
28 |
5 |
9 |
14 |
8 |
|
3 |
10 |
23 |
33 |
3.33 |
7.67 |
11 |
5 |
|
4 |
10 |
33 |
43 |
2.5 |
8.25 |
10.75 |
10 |
|
5 |
10 |
48 |
58 |
2 |
9.6 |
11.6 |
15 |
|
6 |
10 |
68 |
78 |
1.67 |
11.33 |
13 |
20 |
|
7 |
10 |
98 |
108 |
1.43 |
14 |
15.42 |
30 |
|
8 |
10 |
148 |
158 |
1.25 |
18.5 |
19.75 |
40 |

Monopolistically Competitive Equilibrium: Sofi Lens, Inc., has enjoyed rapid growth in sales and high operating profits ort its innovative extended-wear soft contact lenses. However, the company faces potentially fierce competition from a host of new competitors as some important basic patents expire during the coming year. Unless the company is able to thwart such competition, severe downward pressure on prices and profit margins is anticipated.
|
Price ($) |
Monthly Output (Million) |
Total Revenue ($Million) |
Marginal Revenue ($Million) |
Total cost ($Million) |
Marginal cost ($Million) |
Average cost($Million) |
Total profit ($Million) |
|
A |
B |
C |
D |
E |
F |
G |
H |
|
20 |
0 |
0 |
|||||
|
19 |
1 |
12 |
|||||
|
18 |
2 |
27 |
|||||
|
17 |
3 |
42 |
|||||
|
16 |
4 |
58 |
|||||
|
15 |
5 |
75 |
|||||
|
14 |
6 |
84 |
|||||
|
13 |
7 |
92 |
|||||
|
12 |
8 |
96 |
|||||
|
11 |
9 |
99 |
|||||
|
10 |
10 |
105 |
A: Use Soft Lens' current price, output, and total cost data to complete the table
B: Comment upon the results

