PSY230H5 Chapter Notes - Chapter 2: Explained Variation, Effect Size, Internal Consistency


Elizabeth Ho
CHAPTER 2
PSY230
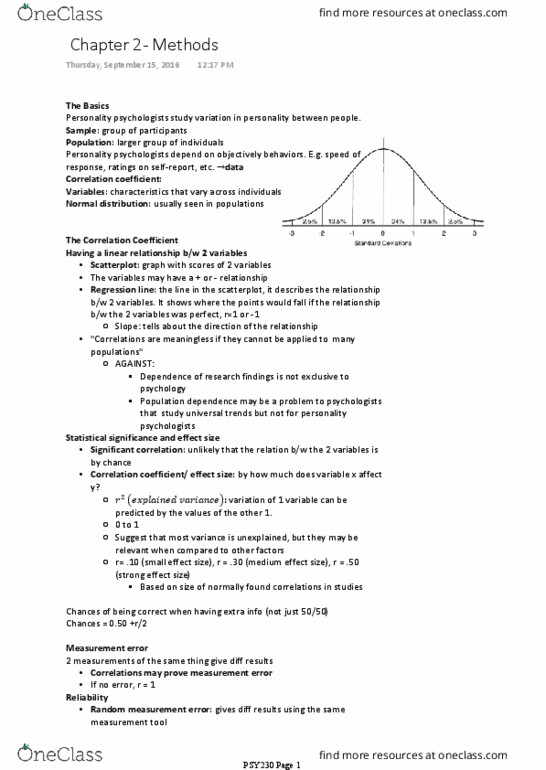
Correlation Coefficient
• Regression line on scatterplot best describes the relationship bw variables x and y
• Perfect correlation— r = 1.0
• Variables are independent— r = 0.0
Statistical Significance and Effect Sizes
Effect size: strength of a relationship
Explained variance: correlation coefficient squared (r2)
• Variation in one variable can be predicted by values of another variable
• Does not increase as quickly as 'r'
• Measurement error can be found in differences bw r and r2
Reliability
• Random measurement error
o Diff scores on same measurement instrument
▪ Ex// 140lbs minute, step on again, 170lbs
• Measure is called reliable if influence of measurement err is weak
• Two tests to test reliability of measures (in pers. Psych)
o Internal consistency
▪ Reqs two measures of same personality characteristic
▪ Average scores of items that mean/measure the same thing
• Ex// "in most ways, my life is close to my ideal" vs "The conditions
of my life are excellent"
▪ Do ^ to all necessary factors and find correlation. Should be pos
o Test-retest correlation
▪ Repeat measurement process twice
▪ Requires delay bw two assessments (bw few min and couple of months)
• Problem w/ this method is bc participants most likely will
remember their answer the first time and will likely try to keep
consistent, skewing the answers/ results
• Reliability should be at least r =.7 for personality measures
o This is actually really low reliability if giving personality results to one person
o If to larger number of participants, r = .5 acceptable bc random err is eliminated
by averaging across large amount of participants
find more resources at oneclass.com
find more resources at oneclass.com
Document Summary
Psy230: regression line on scatterplot best describes the relationship bw variables x and y, perfect correlation r = 1. 0, variables are independent r = 0. 0. Explained variance: correlation coefficient squared (r2: variation in one variable can be predicted by values of another variable, does not increase as quickly as "r, measurement error can be found in differences bw r and r2. Reliability: random measurement error, diff scores on same measurement instrument, ex// 140lbs minute, step on again, 170lbs, measure is called reliable if influence of measurement err is weak, two tests to test reliability of measures (in pers. If to larger number of participants, r = . 5 acceptable bc random err is eliminated by averaging across large amount of participants. Psy230: a measure is valid if it measures what it"s supposed to measure, systematic measurement error. Squares/rectangles: observed variances variance that was recorded w/ measurement instrument.