BIOB50H3 Chapter Notes - Chapter L#16: Aerenchyma, Aeration, Estuary


LECTURE #16, pages: 357-372
CHAPTER 16: THE NATURE OF COMMUNITIES
WHAT ARE COMMUNITIES? (16.1)
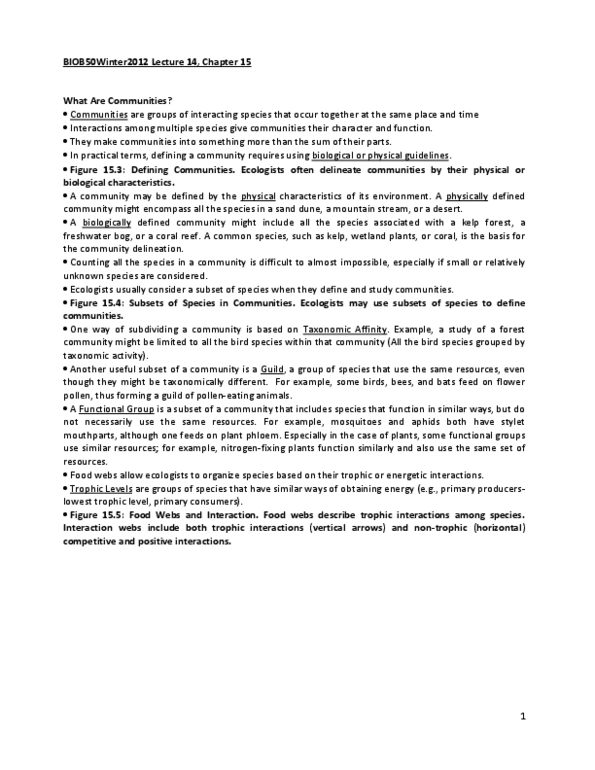
-Communities: groups of interacting species that occur together at the same place and
time int. among multiple species and their physical env. Give comm. Their character
and function
Ecologists often delineate communities by their physical or biological characteristics
- A comm. May be defined by its physical env. eg. A physically defined comm. May have
all the species in a sand dune/mountain stream/a desert
- A biologically defined comm. Might include all the spcies associated w/ a kelp
forest/coral reefs/freshwater bog
- In most cases, comm. Are defined arbitrarily by ecologists eg. If studying aquatic
insects and their amphibian predators, researchers will restrict definion of comm. To
that particular interaction
Ecologists may use subsets of species to define communities
- One common way is to define them based on taxonomic affinity: groups of species
classified together b/c evolutionary lineage
- Another is classifying by guild: a group of species that use the same resources, even
though they may be taxonomically distant eg. Some birds/bees/bats/ feed on the
same pollen
- Last way is through a functional group: a subset of comm. That includes species that
function in similar ways, but may or may not use similar resources (eg. Nitrogen fixing
plants can be paced in the same functional group)
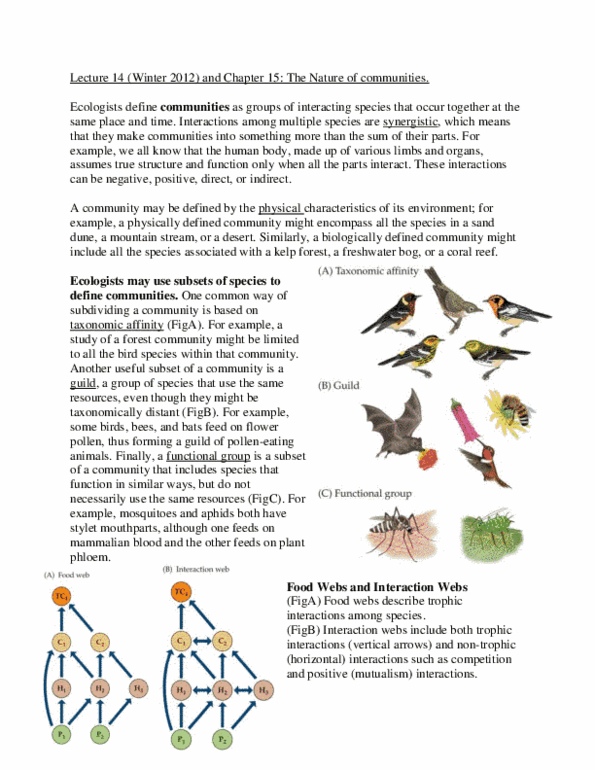
- There are other subsets of comm. That allow ecologists to organize species based on
their trophic (energetic interactions)
Can be organized in a food web food webs can be organized into trophic levels
oLowest trophic level = primary
producers (autotrophs eg.plants)
oSecond level = primary consumers
(eg. The org. that feed on the
primary producers (eg. Herbivores)
oThird level = secondary consumers
(eg. The org. that feed on herbivores,
i.e carnivores)
oFourth level = tertiary consumers
(eg. Org. that eat on 2* consumers)
- Problems with food webs: inform little about
strength of interactions, trophic levels can be
spanned multiple levels (eg. Some species are
omnivores), idealized food webs don’t include
important resources (eg. Detritus that can be consumed by detritivores), do not include
non-trophic interactions (horizontal interactions) such as comp.
find more resources at oneclass.com
find more resources at oneclass.com

- The concept of an interaction web has been used to better accurately describe the
trophic (vertical) and non-trophic (horizontal) interactions among species
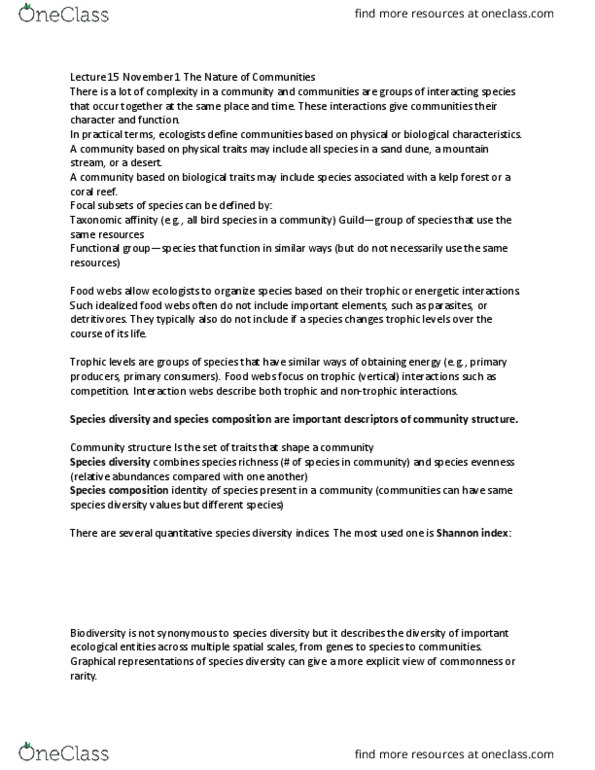
COMMUNITY STRUCTURE (16.2)
-Community structure: the set of
characteristics that shape a community
Species diversity is an important measure of
community structure
-Species diversity: a measure that
combines the 3 of species (species
richness) and their abundances w/ those of
the other species (species evenness) w/I
the community
Species richness: count all the species
in the community
Species evenness: requires knowing
the abundance of each species relative
to those of the other species w/I the
community
-
Shannon
index:
an index
to
describe
species
diversity
quantitatively
lowest possible value of H is zero, and the higher the H-value, the greater the
species diversity
- another term often
used w/ species
diversity is
biodiversity: used to
describe the
diversity of
important ecological
entities that span
multiple spatial
scales (from genes to
species to
communities)
find more resources at oneclass.com
find more resources at oneclass.com

have consequences i.e more gene biodiversity =
more viable population = more persistance = more
species diversity in the community
Species within communities differ in their commonness or
rarity
- Although species diversity indices allow ecologists to
compare different communities, graphical
representations of species diversity can give us a
more explicit view of the commonness or rarity of the
species in communities
rank abundance curves, plot the proportional
abundance of each species (pi) relative to the others
in rank order, l from most abundant to least abundant
- These 2 patterns suggest the tpyes of species interactions that might occurs in these 2
comm. eg. In
comm. A, blue
butterfly might
be dominant, in
B, all of them
might be fairly
equivalent in
their interactions
Species diversity estimates vary with sampling effort and scale
-species accumulation curve: use to calculate by plotting species richness as a function
of sampling effort i.e each data point on a species accumulation curve represents the
total number of species and the sampling effort up to that point more samples = more
individuals are added help to find the threshold at which no new species would be
added by additional sampling
find more resources at oneclass.com
find more resources at oneclass.com
Document Summary
Communities: groups of interacting species that occur together at the same place and time int. among multiple species and their physical env. Ecologists often delineate communities by their physical or biological characteristics. May have all the species in a sand dune/mountain stream/a desert. Might include all the spcies associated w/ a kelp forest/coral reefs/freshwater bog. Are defined arbitrarily by ecologists eg. if studying aquatic insects and their amphibian predators, researchers will restrict definion of comm. Ecologists may use subsets of species to define communities. One common way is to define them based on taxonomic affinity: groups of species classified together b/c evolutionary lineage. Another is classifying by guild: a group of species that use the same resources, even though they may be taxonomically distant eg. some birds/bees/bats/ feed on the same pollen. Last way is through a functional group: a subset of comm.