MGAB01H3 Chapter 2.4: chapter 2.4

26 Oct 2010
School
Department
Course
Professor


16
MGAB01H3 Full Course Notes
Verified Note
16 documents
Document Summary
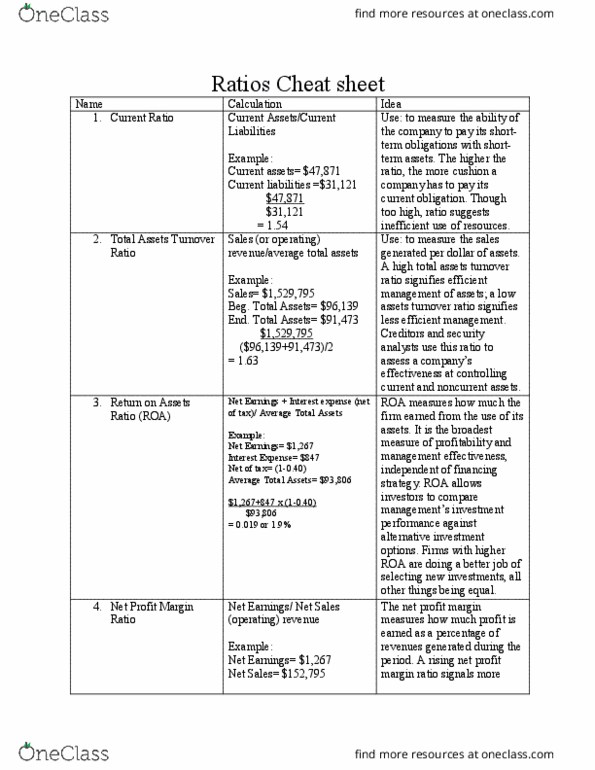
Ratio analysis expresses the relationships between selected items of financial statement data: liquidity, profitability and solvency ratios. There are three comparisons that use ratios: intracompany (same over a period time), intercompany (between competitors of the same industry), and industry average (between industries). Profitability ratios measure a companys earnings or operating success for a given period of time. Earnings per share measures the net earnings for each common share. It is calculated by taking the net earnings available to common shareholders/weighted average number of common shares. Price-earnings ratio is frequently used to measure the ratio of the stock market price of each common share to its earnings per share. It is calculated by dividing the market price per share by earnings per share. The price-earnings ratio shows what investors expect of a companys future earnings. Liquidity ratios measure the short-term ability of a company to pay its maturing obligations and to meet unexpected needs for cash.