STAB22H3 Chapter Notes - Chapter 5: Data Set, Concept Album, Summary Statistics


38
STAB22H3 Full Course Notes
Verified Note
38 documents
Document Summary
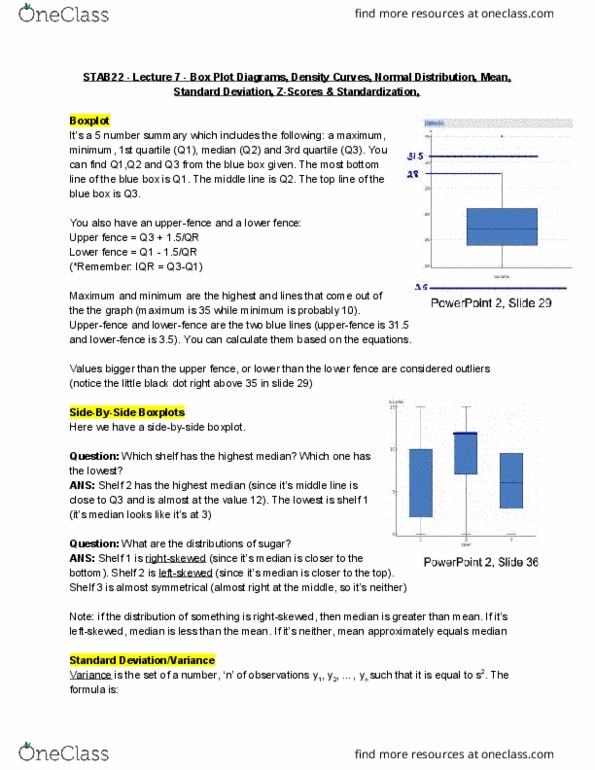
Chapter 5: understanding and comparing data (p. 88) Review: data 10, 11, 14, 15, 17, 19, 21, 28, 35: Q3= median of 17, 19, 21, 28, 35= 21. Find 5-number summary min, q1, median, q3, max. Box goes down the page, with scale on left. Calculate r=1. 5 x iqr: 1. 5(21-14)=10. 5 -> show unusual points. Draw lines ( whiskers ) connecting box to most extreme value within fences. These are suspected outliers and has to be investigated. Smallest data value: 10 -> bigger than lower fence. Biggest data value that is smaller than upper fence: 28. Cereals classified by shelf where found in grocery store: Histogram for each shelf, put results side by side (histogram of sugars, group by shelf, at bottom columns per page = 3) No need for columns per page this time: only one plot. ) Median definitely highest for shelf 2, lowest for shelf 1. Bonus: shelf 1 sugar rightskewed; shelf 2 sugar leftskewed.