STAB57H3 Chapter Notes - Chapter 5.5: Standard Deviation, Point Estimation, Box Plot

Document Summary
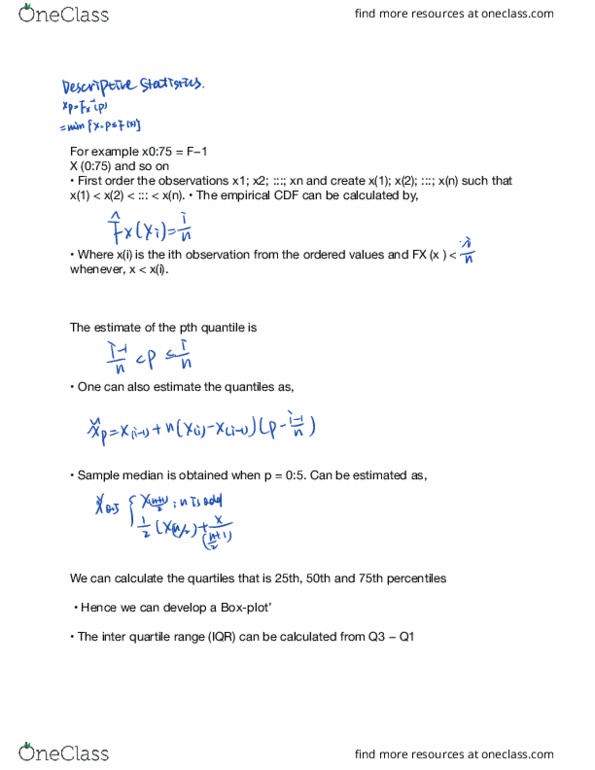
Cp ip titncxi xcx. it estimateat pm quaint tip xpficpwnlxp. Where x(i ) is the ith observation from the ordered values and. When the distribution is symmetric then one should use sample mean and standard deviation for central measure and dispersion: when the distribution is skewed then one should use median and iqr. 304 plots and quantum useaf central measures ipzoiifxn. nu xi ilp. Box-plot is created by plotting minimum, q1, q2, q3 and the maximum. 2types: predicting future response (machine learning, inference about some characteristics of a distribution. Let s be the sample and t (s ) be any estimate of ( ) there are three types of inference to consider: find the estimator t (s ) for ( ). This will be a point estimate: construct a subset c (s ) of the set of possible values of ( ) which we believe contains the true value with a certain probability.