STAB22H3 Chapter Notes - Chapter 3: Marginal Distribution, Bar Chart, Frequency Distribution


38
STAB22H3 Full Course Notes
Verified Note
38 documents
Document Summary
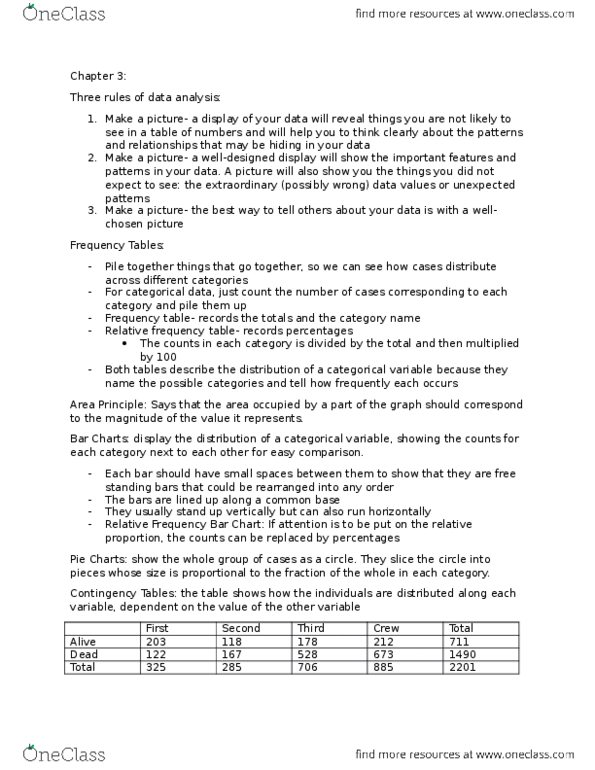
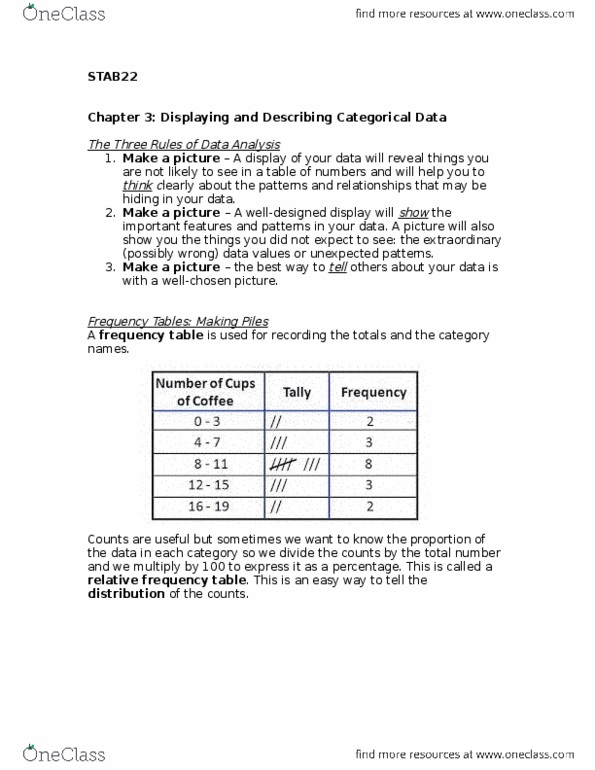
Chapter 3 displaying and describing categorical data. For categorical data: count the number of cases in each category and pile them up. A frequency table records the totals and the category name. A relative frequency table displays proportions or percentages, rather than the counts of the values in each category. Both tables describe the distribution of a categorical variable because they name the possible categories and how frequently each occurs. The best data displays consider the area principle. The area principle says that the area occupied by a part of the graph should correspond to the magnitude of the value it represents. Bar charts make comparisons between categories easy and natural; displays the distribution of a categorical variable, showing the counts for each category next to each other for easy comparison. Should have small spaces between bars to show that the bars are freestanding and can be arranged in any order.