BIO120H1 Chapter Notes - Chapter 5: Phenology, Inbreeding Depression, Genotype Frequency


36
BIO120H1 Full Course Notes
Verified Note
36 documents
Document Summary
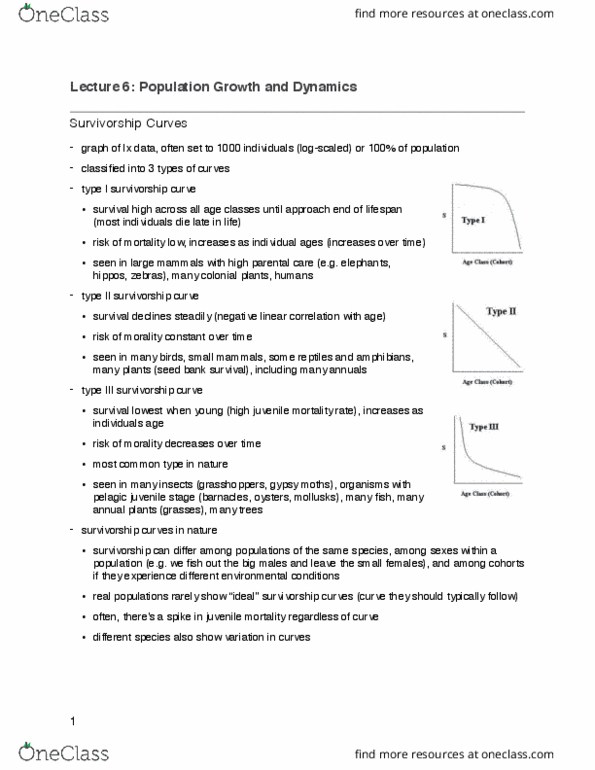
Survivorship curves visually demonstrate how long a species will live. Survivorship curves describe the survivorship in a cohort: if cohorts are similar through time, they can be considered to describe the survivorship of a population. Survivorship curves can be affected by both biotic and abiotic factors (e. g. , competition and temperature) Type 1 survivorship: exhibit high survivorship throughout their life cycle. Type 2 survivorship: have a constant proportion of individuals dying over time. Type 3 survivorship: have a very high mortality at young ages. Most real populations are some mix of these three types. Survivorship curves must be plotted on a log scale to compare with idealized type 1, 2, and 3 curves. Log scale better allows a focus on a per capita effects rather than the actual number of individuals dying. Type 1 survivorship curves include human in developed countries and animals in zoos. This is more typical in k-selected species.