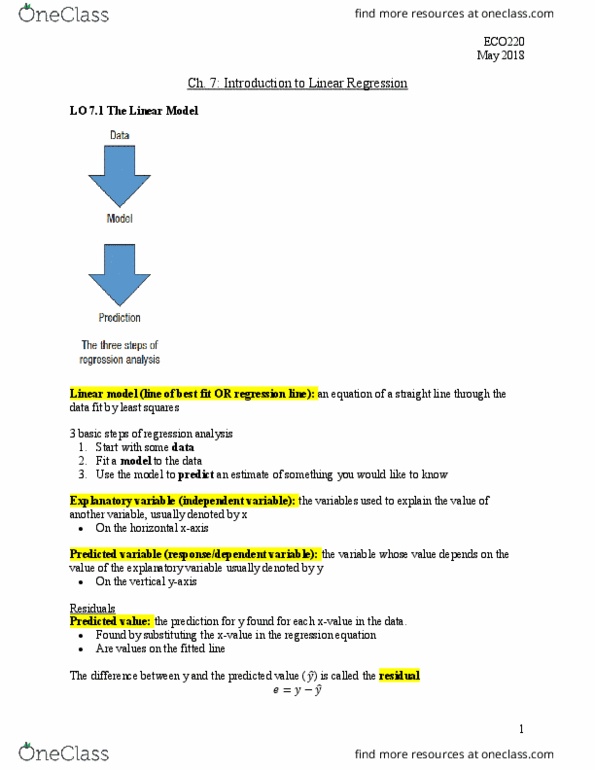
ECO220Y1 Chapter Notes - Chapter 7: Linear Model, Dependent And Independent Variables, Scatter Plot


ECO220Y1 Full Course Notes
Document Summary
Get access


Related textbook solutions


Related Documents
Related Questions

Question 1
Which of the following approaches to understanding and predicting consumer behavior depends primarily on the knowledge and experience of a firm's employees and its suppliers?
| Test marketing and price experiments | ||
| Analysis of historical data. | ||
| Direct consumer surveys. | ||
| Expert opinion. |
Question 2
In which of the following situations would reliance on expert opinion as a basis for a managerial decision be most preferred?
| When the product being marketed is relatively new. | ||
| When the level of economic activity can have a significant effect on the demand for the firm's output. | ||
| When the product can be packaged with a variety of price and quality combinations. | ||
| When the business in question serves as a supplier of inputs to other businesses, especially in multi-product situations where other strategies may be prohibitively expensive. |
Question 3
The approach to analyzing consumer behavior that asks consumers to rank and choose among different product attributes to reveal their relative valuation of different characteristics is called:
| conjoint analysis. | ||
| contingent valuation. | ||
| the hedonic estimation technique. | ||
| a direct consumer survey. |
Question 4
All of the following are limitations of direct consumer surveys except:
| the possibility of response biases because survey respondents may not want to reveal their true preferences. | ||
| the possibility that the type of questions asked may unintentionally bias the respondent's answers. | ||
| the likelihood that respondents will deliberately and systematically mislead interviewers. | ||
| the possibility that consumers' responses may not reflect their actual behavior in the market place. |
Question 5
Which of the following approaches to understanding and predicting consumer behavior does not actually solicit any information from potential customers?
| Expert opinion. | ||
| Test marketing. | ||
| Analysis of historical data. | ||
| Conjoint analysis. |
Question 6
Data collected on a sample of individuals with different characteristics at a specific point in time are called:
| panel data. | ||
| cross-section data. | ||
| time series data. | ||
| none of the above. |
Question 7
Which of the following approaches to understanding and predicting consumer behavior provides the most insight into how consumers can be expected to respond in an actual market setting?
| Test marketing. | ||
| Conjoint analysis. | ||
| Expert opinion. | ||
| Analysis of historical data. |
Question 8
An approach to analyzing consumer behavior in which consumer reaction to different prices is analyzed in a laboratory situation or a test market is called:
| non-price experiments. | ||
| focus groups. | ||
| price experiments. | ||
| none of the above. |
Question 9
Data collected on the same observation unit at a number of points in time are called:
| panel data. | ||
| time series data. | ||
| cross-section data. | ||
| none of the above. |
Question 10
A measure of how much the coefficient would vary in regressions based on different samples is called:
| F-statistic. | ||
| standard error of the estimated coefficient. | ||
| t-statistic. | ||
| partial F-statistic. |
Question 11
The test statistic used to test the hypothesis of whether a regression coefficient is significantly different from zero, holding all other independent variables constant, is called a(n):
| t-test. | ||
| F-test. | ||
| multicollinearity test. | ||
| autocorrelation test. |
Question 12
Regression analysis that analyzes the relationship between one dependent variable and several independent variables is called:
| cluster analysis. | ||
| correlation analysis. | ||
| multiple regression analysis. | ||
| simple regression analysis. |
Question 13
The ratio of the regression coefficient to its standard error is called:
| F-statistic. | ||
| t-statistic. | ||
| coefficient of determination. | ||
| partial F-statistic. |
Question 14
The coefficient of determination will range between what values?
| -1 and +1 | ||
| 0 and 1 | ||
| -3 and +3 | ||
| none of the above |
Question 15
The range of values in which we can be confident that the true regression coefficient lies within a given degree of probability is called a:
| confidence interval. | ||
| logistic regression. | ||
| prediction interval. | ||
| none of the above. |
Question 16
The estimated regression equation is Y = 10 + 2.5X, if X =0 than the predicted value of Y is equal to
| 2.5 | ||
| 7.5 | ||
| 12.5 | ||
| 10 |
