ECO220Y1 Chapter Notes - Chapter 4: Bar Chart, Frequency Distribution, Contingency Table


27
ECO220Y1 Full Course Notes
Verified Note
27 documents
Document Summary
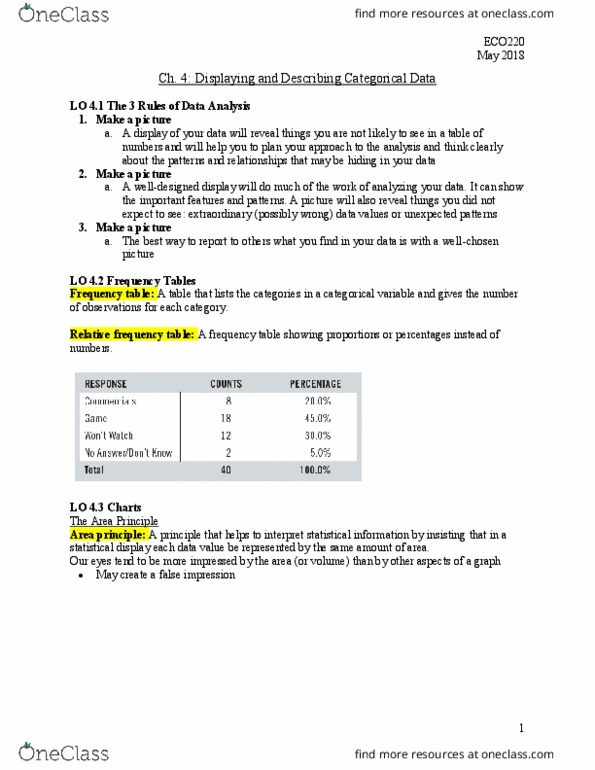
The main rule of data analysis: make a picture (will help to reveal things you"re not likely to see in a table of numbers, and will help you report your findings to others) Frequency table: tells us how frequent something exists (ie) how many loblaws stores in ontario. Relative frequency table: records percentages to show how many __ there are relative to the total (ie) how many stores in ontario relative to total canadian stores. Not to be confused by the area* -height tells us how many times 1 item is relative to another. Area principle: area occupied by a part of the graph should correspond to the magnitude of the value it represents. Bar charts: -give us an accurate visual impression of the distribution. Bar chart: displays the distribution of a categorical variable, showing the counts for each category next to each other for easy comparison space bw each bar.