PSY201H1 Chapter Notes -Scatter Plot, Behavioural Sciences, Squared Deviations From The Mean

Document Summary
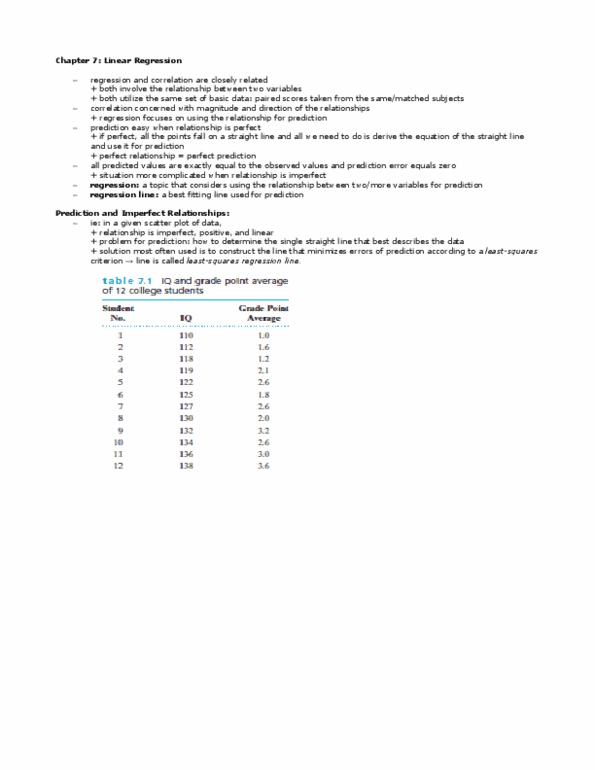
+ both involve relationship between two or more variables. + correlation primarily concerned with finding out whether a relationship exists and with determining its magnitude and direction, whereas regression is primarily concerned with using the relationship for prediction. Relationships: deals with magnitude and direction of relationships. Linear relationships graph used to plot out the relationship between x and y variables are called scatter plot. + a graph of paired x and y values points that fall on a straight line. + when a straight line describes the relationship between two variables, it"s linear. + linear relationship between two variables is one in which the relationship can be most accurately represented by a straight line some relationships are curvilinear. + when a scatter plot of the x and y variables are drawn, a curved line fits the points better than a straight line deriving the equation of the straight line.