SOC202H1 Chapter : summary for chp13

Document Summary
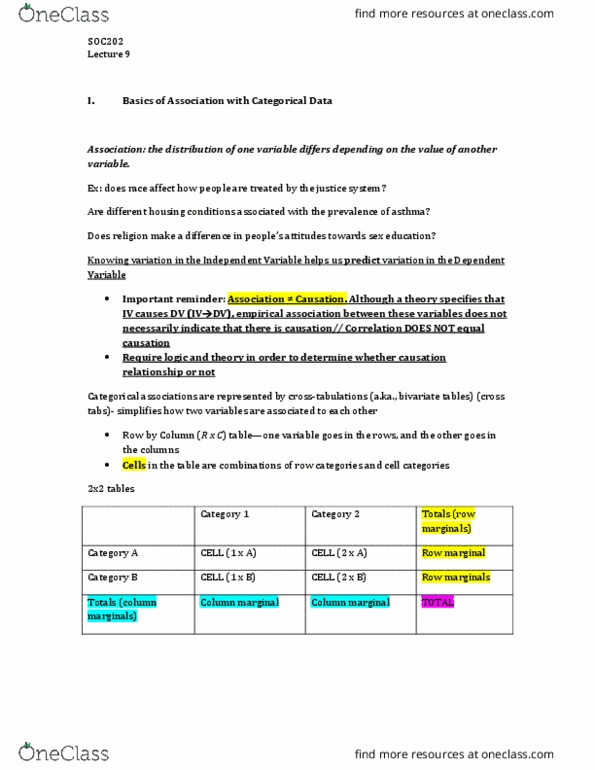
present data in a cross-tabulation table (it compares two nominal ordinal variables at ounce essential for testing a hypothesis about the relationship between these two variables. The # in a cell represents the frequency of joint occurrences of the categories of the 2 variables. Joint occurrence is the combination of categories for a single individual. colum% : is a cell"s frequency as a % or the marginal total/ row %: is a cell"s frequency as the row marginal total. The existence of a relationship between two nominal ordinal variables is established with a hypothesis test called the chi-square test . In a cross tab table we put the independent variable in the columns and the dependent variable in the rows. The hypothesis is stated in a way that allows us to know what sampling outcomes to expect when hypothesise is true.