STA220H1 Chapter Notes - Chapter 4: Histogram, Standard Deviation, Interquartile Range

10 Dec 2013
School
Department
Course
Professor


36
STA220H1 Full Course Notes
Verified Note
36 documents
Document Summary
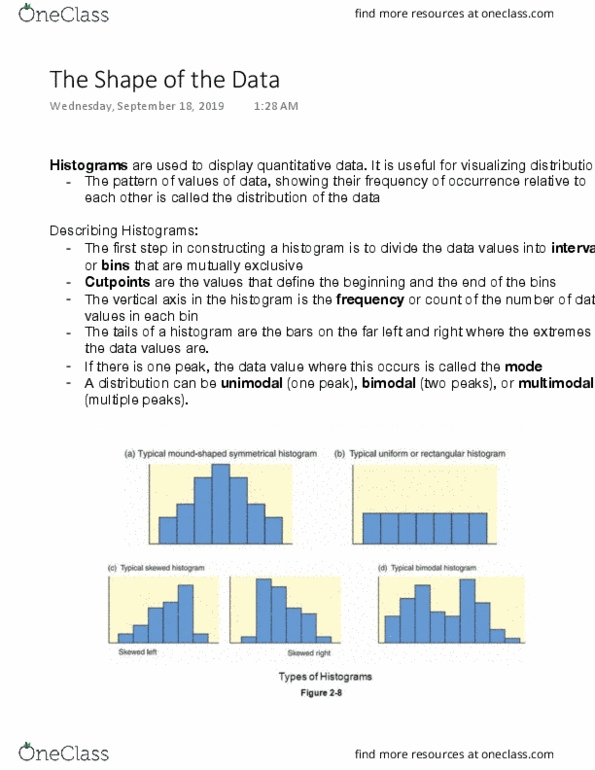
We can display the distribution of quantitative data with a histogram, a stem-and- lead display, or a dotplot. We tell what we see about the distribution by talking about shape, center, spread, and any unusual features. Distribution: the distribution of a quantitative variable slices up all the possible values of the variable into equal width bins and gives the number of values (or counts) falling into each bin. Histogram: uses adjacent bars to show the distribution of a quantitative variable. Each bar represents the frequency (or relative frequency) of values falling in each bin. Bins slice up all the values of the quantitative variable, so any spaces in a histogram are actual gaps in the data, indicating a region where there are no observed values. Relative frequency histogram: replacing counts on the vertical axis with the percentage or proportion of the total number of cases falling in each bin.