MSCI 1000 Chapter Notes - Chapter 4: Marginal Distribution, Contingency Table, Bar Chart

21 Jun 2018
School
Department
Course
Professor

CHAPTER 4 – Displaying and Describing Categorical Data
Make a picture
- display data ! help see what you are not likely to see in table ! help plan approach to
analysis
- shows important features, patterns and relationships
- reveals extraordinary (or possible wrong) data
- best way to report data to others
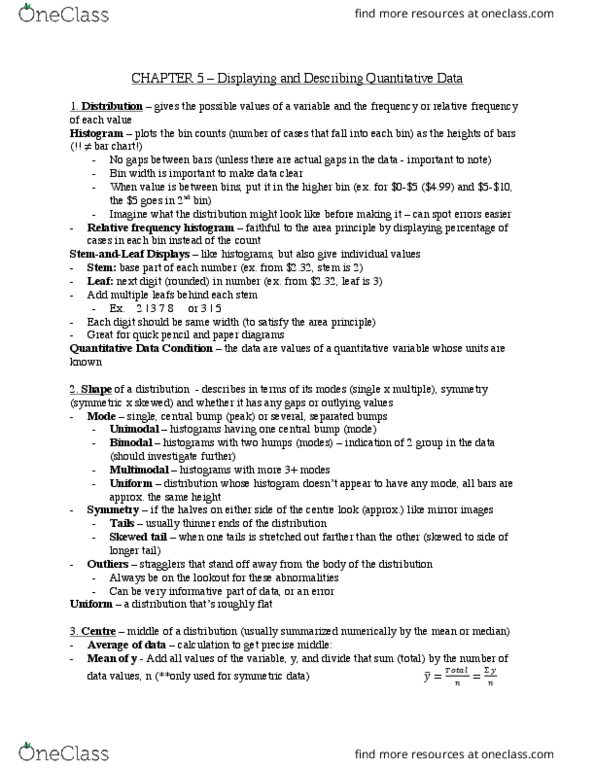
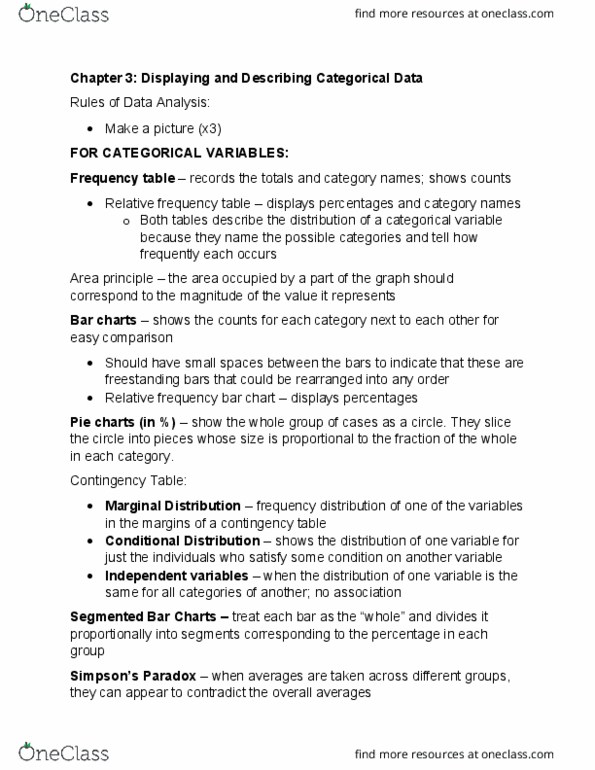
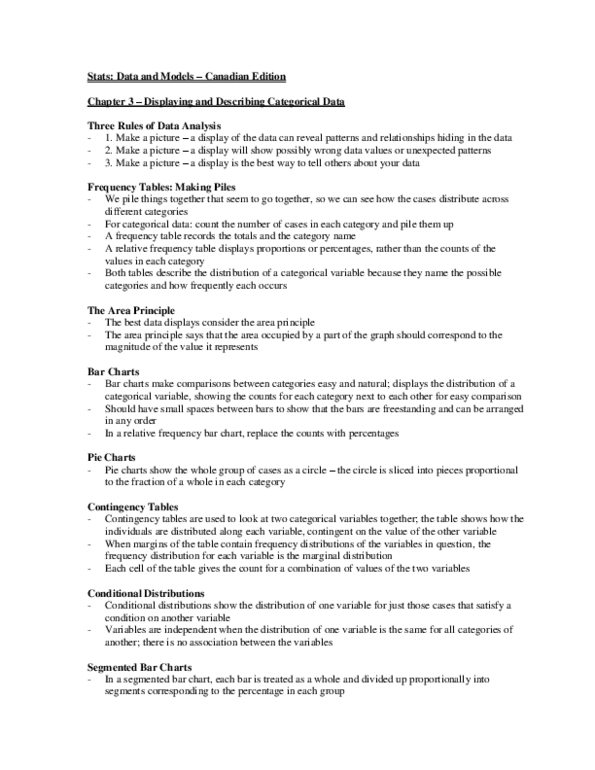
Frequency Tables – shows number of cases (ex. website visits) for each category and records
totals and category names (ex. provinces)
- describe the distribution of a categorical variable – name possible categories and tell how
frequently each occurs.
Relative frequency table – displays percentages, rather than the counts, of each of the value in
each category
Charts:
- The area principle – the area occupied by a part of the graph should correspond to the
magnitude of the value it represents
- Bar charts – displays the distribution of a categorical variable, showing the counts for each
category next to each other for easy comparison
- more accurate visual impression of the distribution
- common base, freestanding, spaces in-between
- horizontal or vertical
- Relative frequency bar chart – replacing counts with percentages, draws attention to
proportion
- Pie Charts – severe perceptual problems, hard to interpret – try not to use them!
Categorical Data Condition – that the data are counts or percentages of individuals in
categories
- make sure categories don’t overlap
** best perception of – positions of common scale (ex. plot or bar graph), comparing 2 separate
images with same scale, length
worst perception – volume, colour, angles, area
Contingency tables – shows how individuals are distributed along each variable, depending on
(contingent on), the value of the other variable
- marginal distribution – in a contingency table, the distribution of either variable alone.
The counts or percentages are the totals found n the margins (usually the right-most column
or bottom row) of the table.
- each cell – gives the count for a combination of values of the two variables
- total percentage, row percentage, column percentage
Conditional distribution – shows the distribution of one variable for just those cases that satisfy
a condition on another
Independent variable – when the distribution of one variable is the same for all categories of
another, in a contingency table (no association between the variables)
Segmented Bar Charts – treats each bar as the “whole and divides it proportionally into
segments corresponding to the percentage in each group
Document Summary
Chapter 4 displaying and describing categorical data. Display data help see what you are not likely to see in table help plan approach to analysis shows important features, patterns and relationships reveals extraordinary (or possible wrong) data. Best way to report data to others. Frequency tables shows number of cases (ex. website visits) for each category and records totals and category names (ex. provinces) Describe the distribution of a categorical variable name possible categories and tell how frequently each occurs. Relative frequency table displays percentages, rather than the counts, of each of the value in each category. The area principle the area occupied by a part of the graph should correspond to the magnitude of the value it represents. Bar charts displays the distribution of a categorical variable, showing the counts for each category next to each other for easy comparison. More accurate visual impression of the distribution common base, freestanding, spaces in-between.