Management and Organizational Studies 3370A/B Chapter Notes - Chapter 4: Contribution Margin, Fixed Cost, Variable Cost

22 Dec 2019
School
Department
Professor
Document Summary
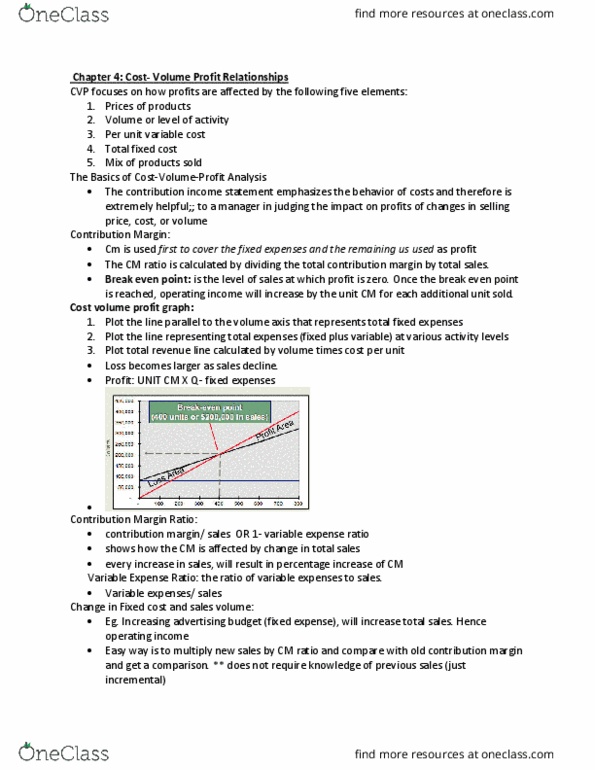
Sales variable expenses fixed expenses = sh. If 400 units are sold in a month, they will be operating at break-even point: we do not need to prepare an income statement to estimate profits at a particular sales volume. Simply multiply the number of units sold above break-even by the contribution margin per unit. If 430 units are sold, the net operating income will be ,000: 30 units above break-even = 30 x 200 = 6,000. Cost-volume-profit relationships in graphic form: relationships among revenue, cost, profit and volume can be expressed graphically by preparing a. Below is a contribution margin income statement at 300,400, and 500 units sold: we will use this information to prepare the cvp graph, preparing the cost-volume-profit graph. Income statement: sales revenues, variable expenses, and cm expressed as a % of sales, cm ratio, contribution margin as a % of sales, = total cm / total sales, ex.