Sociology 2205A/B Chapter Notes - Chapter Chapter 13: Empirical Relationship, Total Variation, Adobe Freehand

11 Jan 2018
School
Department
Course
Professor
Document Summary
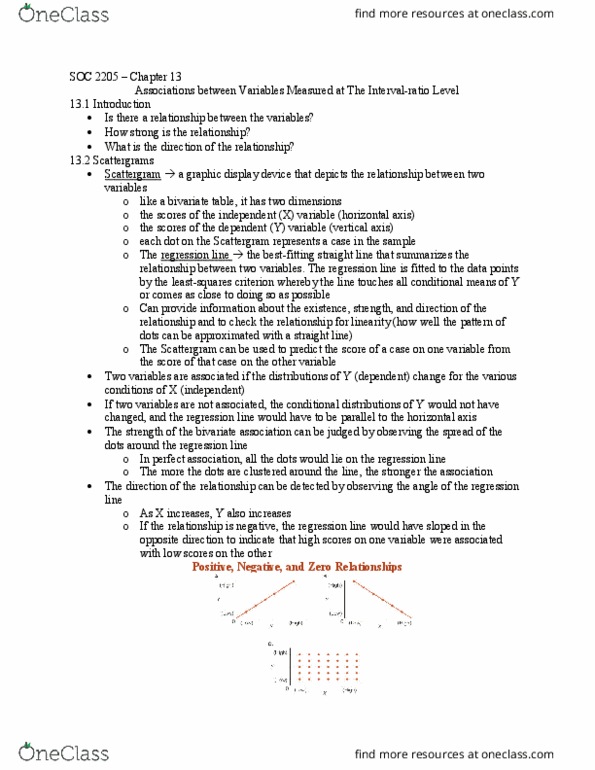
Association between variables measured at the interval- ratio level. Specifically, the researcher wonders if the number of children in the family is related to the amount of time the husband contributes to housekeeping chores. Figure 13. 1 shows a scattergram displaying the relationship between number of children and. In section 13. 3, a precise technique for fitting this line to the pattern of the dots will be explained. We will briefly examine each of these uses: to determine the existence of a relationship, we can return to the basic definition of an association stated in chapter 11. Two variables are associated if the distributions of y (the dependent variable) change for the various conditions of x (the independent variable) In figure 13. 1, scores on x (number of children) are arrayed along the horizontal axis. The dots above each score on x are the scores (or conditional distributions) of y.