Statistical Sciences 1023A/B Chapter Notes - Chapter 11: Scatter Plot, Randomized Experiment, Ideal Class Group

20 Apr 2017
School
Department
Professor
Document Summary
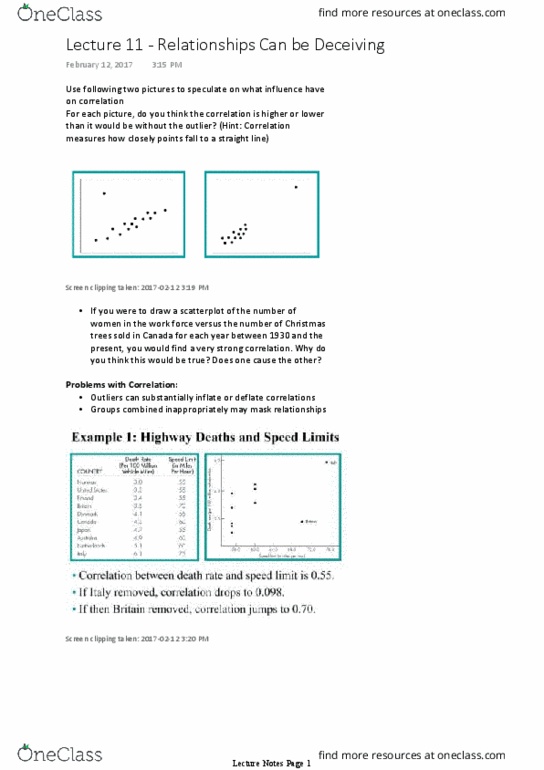
Use the following two pictures to speculate on what influences outliers have on correlation. For each picture, do you think the correlation is higher or lower than it would be without the outlier? (hint: correlation measures how closely points fall to a straight line) Correlation between death rate and speed limit is 0. 55 drops to 0. 098 (much higher death rate than the other countries) correlation jumps to 0. 70. Outliers can be legitimate data like italy and britain in example 1. Outliers can occur due to erroneous recording at least 5% of data points are corrupted. Theory of correlation was developed with the idea that both measurements were from bell-shaped distributions, so outliers are unlikely. Correlation is . 689, relatively strong positive association. If sanfran earthquake of 1906 removed, correlation is -. 92; higher magnitude quakes associated with fewer deaths. The 1906 quake was before earthquake building codes were enforced. Next largest quake was in 1992, occurred in sparsely populated area.