GG101 Chapter Notes - Chapter 5: Calm Air, Thermal Equator, Solar Irradiance

Document Summary
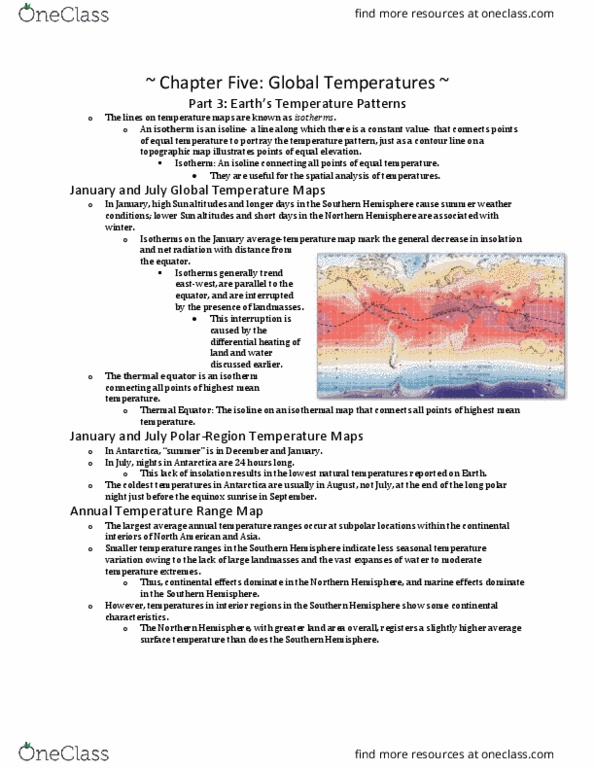
We focus on the temperature maps are for january and july instead of the solstice months of. Isotherms the lines on temperature maps that connects points of equal temperature and portrays the temperature patterns, just like contour lines on a topographic map. Isotherms mark general decrease in insolation and net radiation with distance from the equator. Isotherms are generally zonal trending east to west parallel to the equator and are deflected by land masses. January tempurature maps (see figures 5. 13 and 5. 14) Figure 5. 13 shows january"s mean temperatures for the world. Sh the higher sun altitude causes longer days and summer weather conditions. Nh the lower sun angle causes short days and winter conditions. Thermal equator is an isotherm connecting all points of highest mean temperature, roughly 27 c, it trends southward into the interior of south america and africa, indicating higher temperatures over landmasses. Colder over continental interiors and mountains, warmer over oceans.