PS102 Chapter Notes - Chapter Part 2: Descriptive Statistics, Central Tendency, Standard Deviation

Document Summary
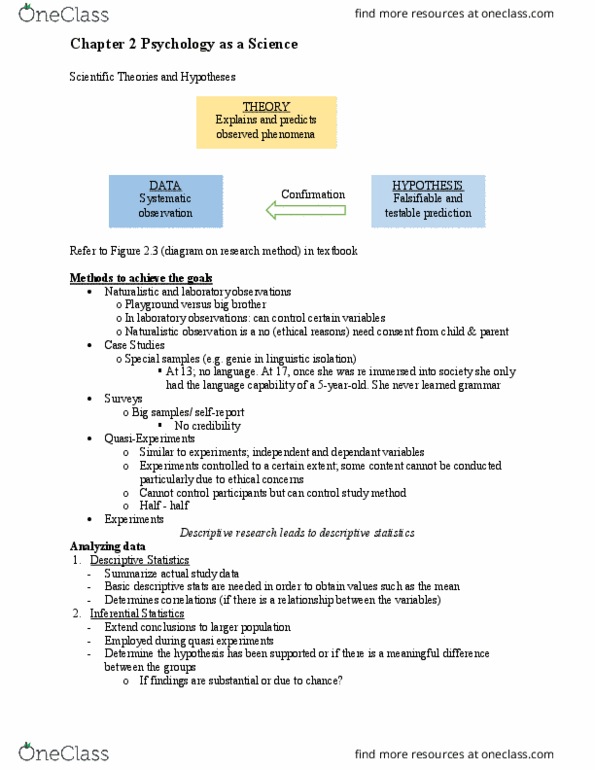
Determine correlations (if these is a relationship between variables) Determine the hypothesis has been supported or if there is a meaningful difference between the groups. The mean, median, mode (aka measured of central tendency) The standard deviation, the range (aka measures of variability) Answer the question: how much do the scores differ from one another. Variability-gives how much variability a scare has from the mean. Little variability-all bunched up close to the mean. Add all the scores, then divide by the number of scores. Ex: employees depression score of company a: 500, 600, 700, 1000 = mean. Is more affected by outliers (extreme scores) depression score = 2800 / 4 = 700. Ex: employees depression score of company b: 500, 600, 700, 10,000 = 11,800 / With extreme scores do not use mean because the results will be too drastic. The one that falls in the middle of the distribution. Mode is the most commonly or frequently occurring score.