OMIS 2010 Chapter Notes - Chapter 17: Response Surface Methodology, Linear Regression, F-Test

10 Aug 2014
School
Course
Professor
Document Summary
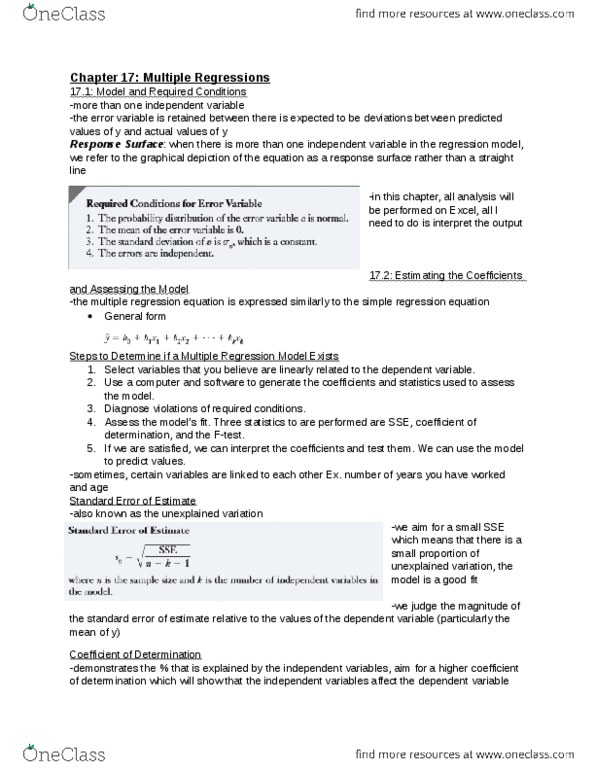
Assume that k independent variables potentially related to dependent variable. Y = b0 + b1x1 + b2x2 + bkxk +e: y is the dependent variable, x1, x2 xk are independent variables, e is error variable, b0, b1 . Deviations between additional independent variables included, deviations between predicted values of y and actual values of y will occur. Response surface: graphical depiction of equation when more than independent variable is in regression model. Probability distribution of the error variable is normal. Standard deviation of error variable is a constant. Determine how well model fits the data. Interpret the coefficient; use the model to predict value of dependent variable or estimate expected value of dependent variable. Only screen independent variables and include those that affect dependent variable. Larger the # of independent variables, increased probability of type 1 error. Multi-collinearity: dependent variable, when one or more are allow use to conclude that none of independent variables are linearly related to.