MATH 148 Chapter Notes - Chapter 3: Xunit, Contingency Table, Selective Breeding

11 Sep 2016
School
Department
Course
Professor
Document Summary
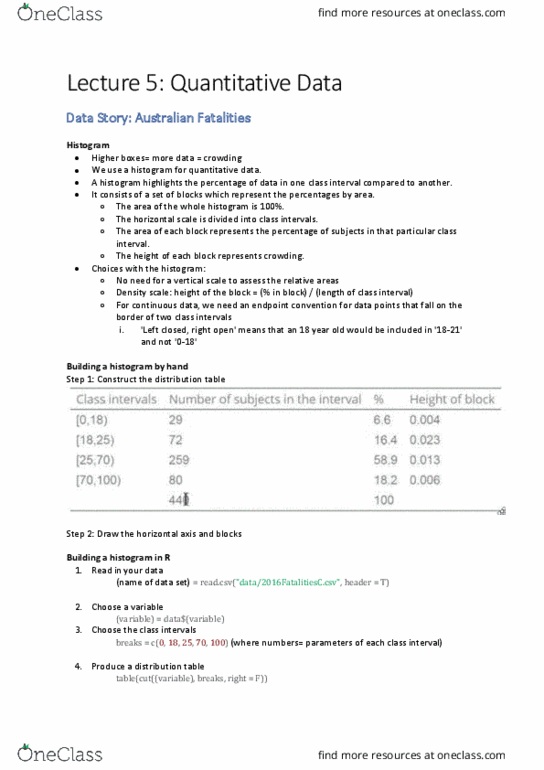
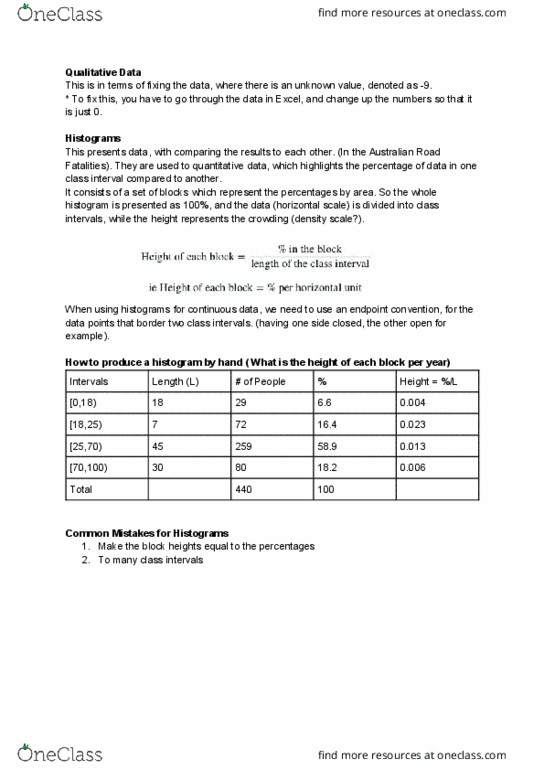
Class intervals ranges on the horizontal scale (x-axis) Blocks are drawn so they are proportional to each other and what they represent. Distribution table shows percentages of data being measured. Endpoint convention boundary between two class intervals (left or right endpoint) Steps to drawing histogram: draw a horizontal axis (usually with even intervals, draw blocks area of block should equal percentage. Y-value = area/x-value: y-units = percent per x-unit. Block that covers larger area represents larger percent. Height of block represents crowding (percentage per horizontal unit) Interval 8-9 yrs is more crowded (taller), but interval 9-12 has more people (area) Variable characteristic which changes from person to person in a study. Quantitative numbers (ie: age, family size, family income) Discrete only differ by fixed amounts (ie: family size- two families can differ in size by 0, 1, 2, etc. but nothing in between) Continuous difference can be continuously smaller (ie: age- cam be different by year, month, day, hour, etc)