ECO 203 Chapter Notes - Chapter 2: Contingency Table, Frequency Distribution, Bar Chart

Document Summary
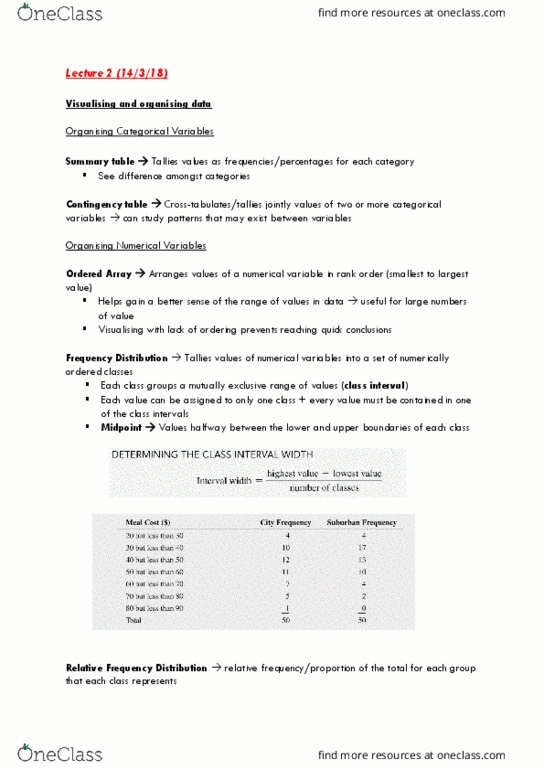
Summary table: tallies the set of individual values as frequencies or percentages for each category. A summary table helps users see the di erences among the categories by displaying the frequency, amount, or percentage of items in a set of categories in a separate column. Contingency table: cross-tabulates/ tallies together the data of two or more categorical variables allowing users to study patterns that may exist between variables. In a contingency table, both the rows and the columns represent variables. Unless the number of values to organize is very large, you begin with an ordered array which arranges data for a numerical variable in rank order from smallest to largest. Frequency distribution: tallies the values of a numerical variable into a set of numerically ordered classes. Class interval: a mutually exclusive range of values. Interval width = highest value - lowest value / number of classes. Midpoints: values that are halfway between the lower and upper boundaries.