PSY 4930 Chapter Notes - Chapter 8: Normal Distribution, Raw Score, Kurtosis

Document Summary
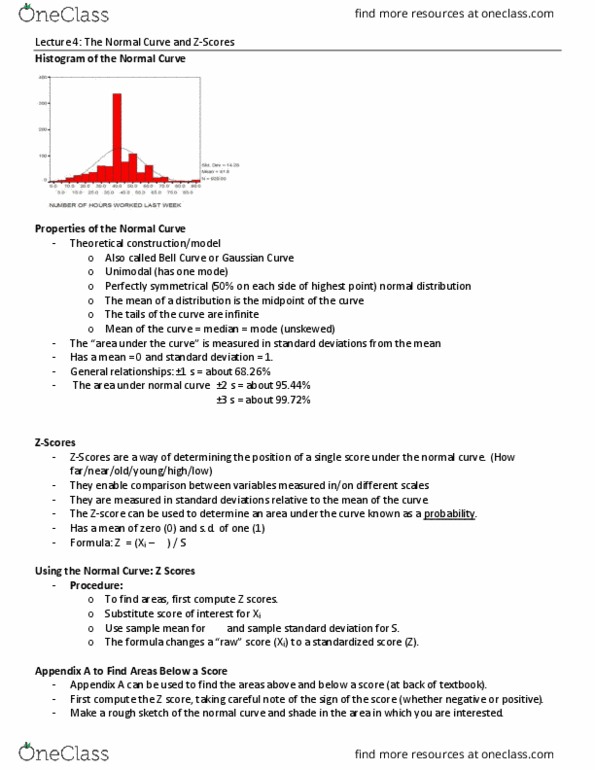
Normal curve helps us understand probability of all outcomes. A visual representation of the distribution of scores: shows an even distribution for mean, median, & mode. Probability is the basis for normal curve & inferential statistics. Tails are asymptotic, meaning they come close to the horizon but never touch it. Provides a basis for understanding the probability associated with any possible outcome. Raw score that is adjusted for the mean & standard deviation of the distribution from which the raw score comes. The formula for calculating z-scores: = . Z = z-score x = individual score = mean s = standard deviation. *standard deviation can also be written as . Observations about z-score: below the mean, it"s negative, above the mean, it"s positive. To the right of the mean, it"s positive. To the left of the mean, it"s negative. It represents a particular location along the x-axis of a distribution. Those locations represent the percentages/probabilities of a certain score occurring.