MATH 1070 Chapter Notes - Chapter 3: Squared Deviations From The Mean, Box Plot, Interquartile Range

Document Summary
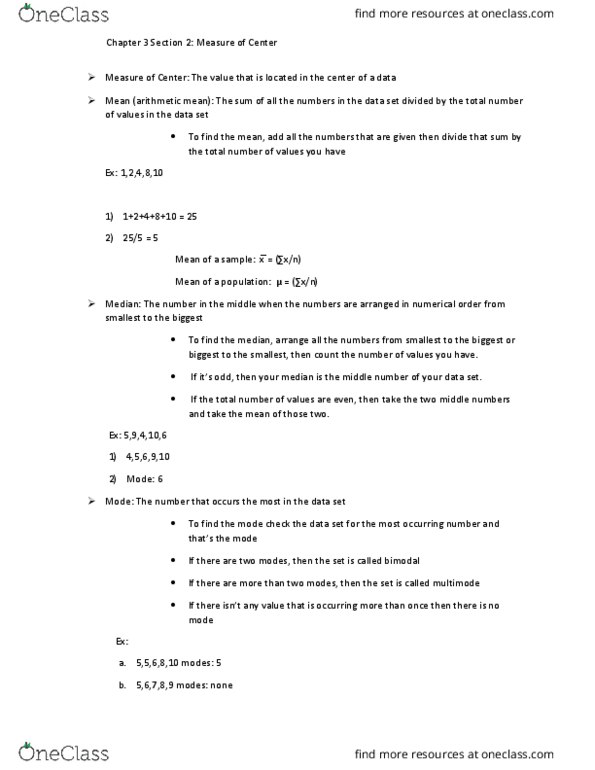
The arithmetic mean of a variable is computed by adding all the values of the variable in the data set and dividing by the number of observations. The population arithmetic mean, (pronounced mew ), is computed using all the individuals in a population. The sample arithmetic mean, x-bar, is computed using sample data. The median of a variable is the value that lies in the middle of the data when arranged in ascending order. A numerical summary of data is said to be resistant if extreme values (very large or small) relative to the data do not affect its value substantially. The median is resistant, while the mean is not resistant. The mode of the variable is the most frequent observation of the variable that occurs in the data set. If no observation occurs more than once, we say the data have no mode. Dispersion is the degree to which the data are spread out.