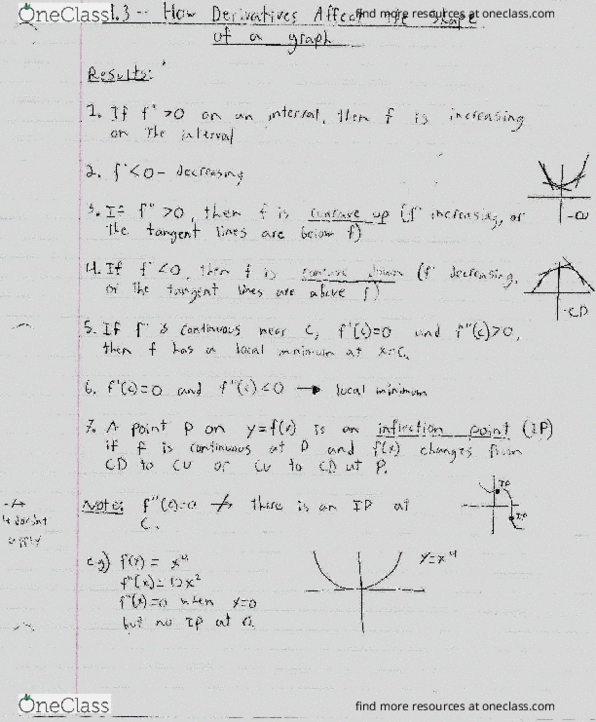
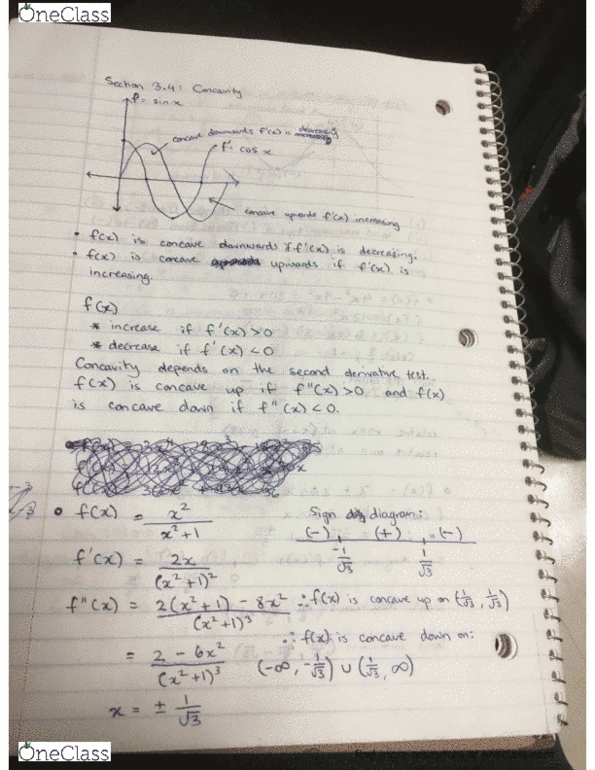
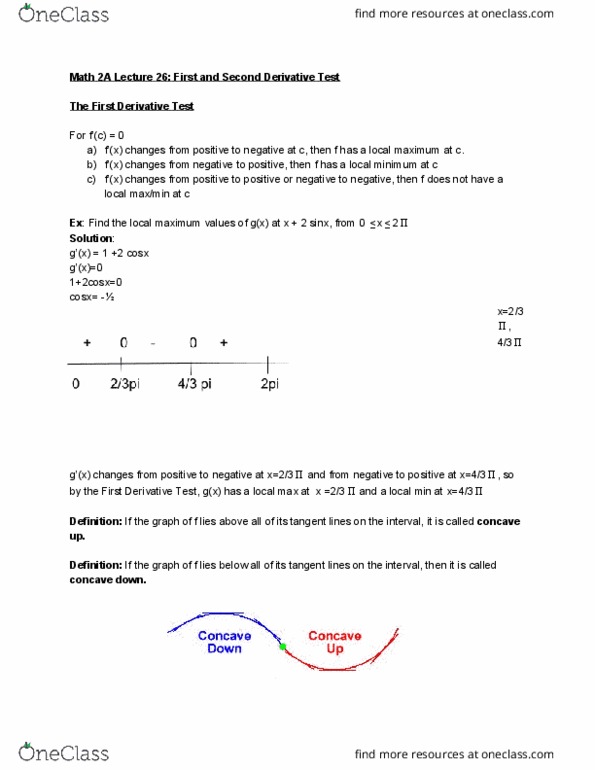
Produce graphs of f that reveal all the important aspects of the curve. In particular, you should use graphs of f' and f " to estimate the intervals of increase and decrease, extreme values, intervals of concavity, and inflection points f(z) =: 4z4-32z' + 89z2-95z + 29 (a) Intervals of increase are at (b) Intervals of decrease are at (c) fhas a local maximum at a- (d) f has a local minimum at z = (e) The graph of f is concave up on the interval | (f) The graph of f is concave down on the interval (g) f has inflection points at z
Sketch the graph by hand using asymptotes and intercepts, but not derivatives. Then use your sketch as a guide to produeing graphs (with a graphing device) that display the major features of the curve. Use these graphs to locate the maximum and minimum values. r(x 1) f(z) has local minima at z = Preview f(a) has local maxima at Preview
Show transcribed image text Produce graphs of f that reveal all the important aspects of the curve. In particular, you should use graphs of f' and f " to estimate the intervals of increase and decrease, extreme values, intervals of concavity, and inflection points f(z) =: 4z4-32z' + 89z2-95z + 29 (a) Intervals of increase are at (b) Intervals of decrease are at (c) fhas a local maximum at a- (d) f has a local minimum at z = (e) The graph of f is concave up on the interval | (f) The graph of f is concave down on the interval (g) f has inflection points at z
Sketch the graph by hand using asymptotes and intercepts, but not derivatives. Then use your sketch as a guide to produeing graphs (with a graphing device) that display the major features of the curve. Use these graphs to locate the maximum and minimum values. r(x 1) f(z) has local minima at z = Preview f(a) has local maxima at Preview