MGSC 2301 Chapter Notes - Chapter 2: Exploratory Data Analysis, Pie Chart, Coca-Cola

16 Dec 2016
School
Department
Course
Professor
Document Summary
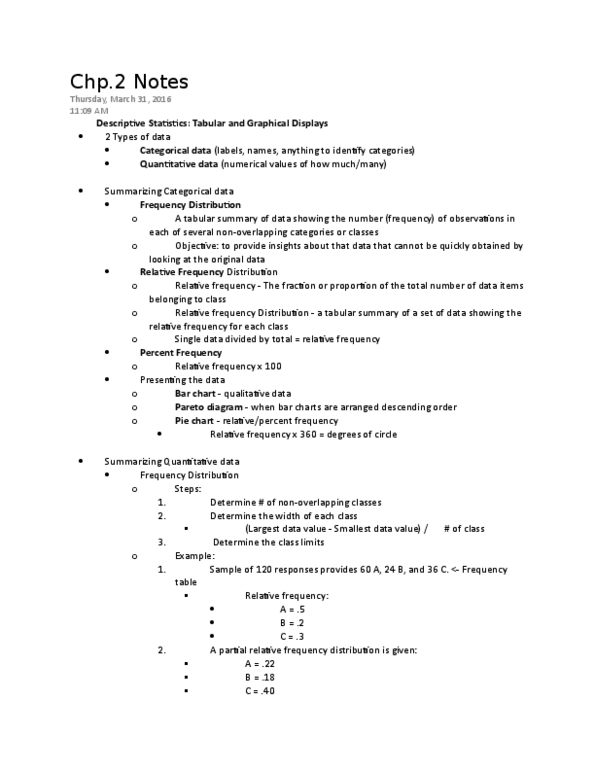
Chapter 2: descriptive statistics: tabular and graphical presentations. Categorical data: labels or names used to identify categories of like items. Quantitative data: numerical values that indicate how much or how many. Frequency distribution: a tabular summary of data showing the number (frequency) of data values in each of several nonoverlapping classes. Relative frequency distribution: a tabular summary of data showing the fraction or proportion of data values in each of several nonoverlapping classes. Percent frequency distribution: a tabular summary of data showing the percentage of data values in each of several nonoverlapping classes. Bar chart: a graphical device for depicting qualitative data that have been summarized in a frequency, relative frequency, or percent frequency distribution. Pie chart: a graphical device for presenting data summaries based on subdivision of a circle into sectors that correspond to the relative frequency for each class. Class midpoint: the value halfway between the lower and upper class limits.