01:119:117 Chapter Notes - Chapter 2: Statistical Inference, Serial Dilution, Biuret

7 May 2018
School
Department
Course
Professor

Biological Research Laboratory 01:119:117 Spring 2018
Lab 2 Assignment – The Scientific Method
Name: Zunny Castillo Section: 07
Part A: Determine Enzyme Extract Concentration
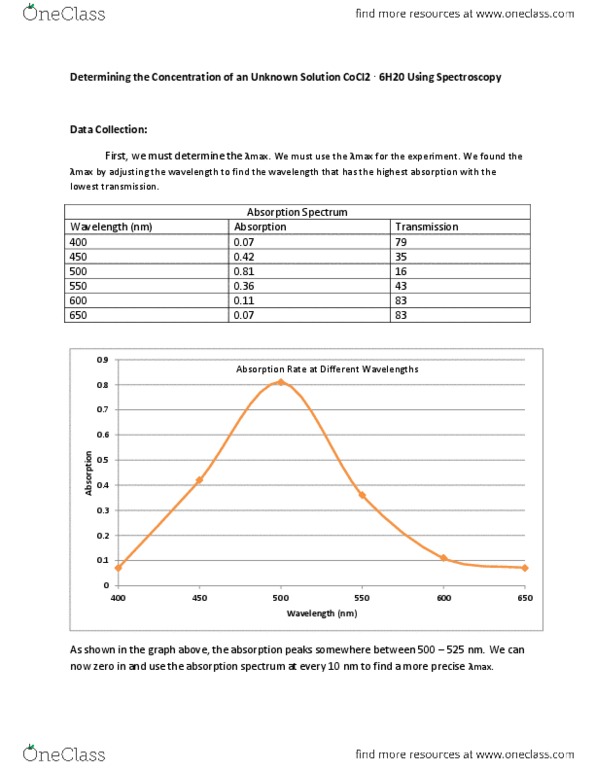
In Part II Exercise 1, you ran a biuret assay to determine the protein concentration of the enzyme extract
using a standard curve. Use the values from your serial dilution to generate a standard curve with a
linear trendline equation and R2 value in Excel. Double check that your graph has all of the aspects
needed for a graph, including a Title, Axis labels, and a Legend. Make sure you use your pair’s data
recorded in the lab manual for this assignment.
Copy and paste the standard curve here:
Legend: A graph that shows the relationship between absorbance and concetration from the biuret
assay of enzymes, which is directly proportional. By using a SpectroVis we were able to measere the
absorbance at 540nm and the concentration using a the step dilution factor of x2. The blue line shows a
line of best fit and its equation above it, which was retrevied from Excel. The R^2 value of .9893 is above
.97 which indicates that our data is accurate.
Input absorbance values from Table 2.2
Cuvette
Number
0
1
2
3
4
Enzyme
Extract
Absorbance
.897
.541
.269
.131
.080
.190
1. Write the linear trendline equation here:
x = (y-0.0417)/0.0441
y = 0.0441x + 0.0417
R² = 0.9893
0
0.1
0.2
0.3
0.4
0.5
0.6
0.7
0.8
0.9
1
0 5 10 15 20 25
Absorbance at 540nm
Concentration (mg/ml)
Standard Curve for Enzyme Extract
find more resources at oneclass.com
find more resources at oneclass.com
Document Summary
In part ii exercise 1, you ran a biuret assay to determine the protein concentration of the enzyme extract using a standard curve. Use the values from your serial dilution to generate a standard curve with a linear trendline equation and r2 value in excel. Make sure you use your pair"s data recorded in the lab manual for this assignment. Standard curve for enzyme extract y = 0. 0441x + 0. 0417. 5 t a e c n a b r o s b. Legend: a graph that shows the relationship between absorbance and concetration from the biuret assay of enzymes, which is directly proportional. By using a spectrovis we were able to measere the absorbance at 540nm and the concentration using a the step dilution factor of x2. The blue line shows a line of best fit and its equation above it, which was retrevied from excel. 97 which indicates that our data is accurate.