01:160:161 Chapter Notes - Chapter 11.7-11.9: Phase Diagram

20 Dec 2018
School
Department
Course
Professor
Document Summary
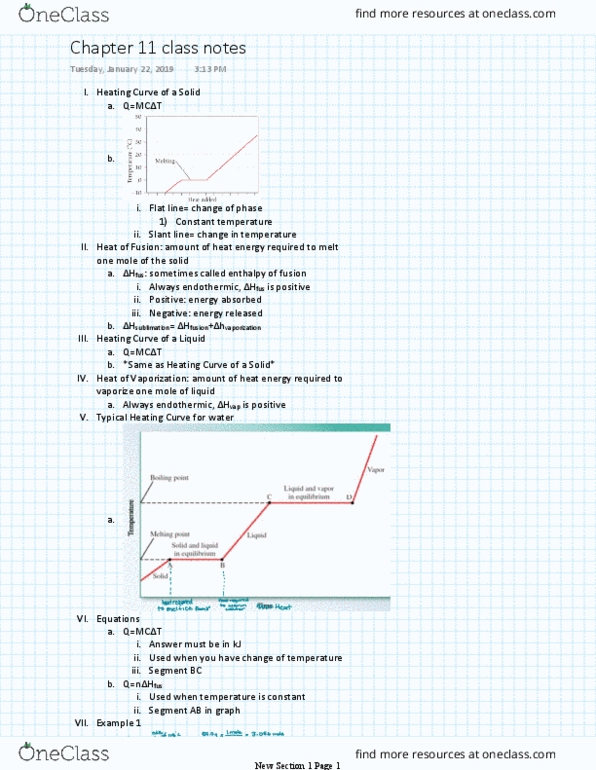
In the heating curve diagram, we can divide the process into five segments: ice warming, ice melting into liquid water, liquid water warming, liquid water vaporizing into steam, steam warming. In segment 2 and 4, the temperature is constant as heat is added because the added heat goes into producing the transition between states, not into increasing the temperature. The two states are in equilibrium during the transition. In the other three segments, 1,3 and 5, temperature increases linearly. In segment one, the amount of heat required to heat the solid ice is given by: q=m x c x t. In segment two (transition), the amount of heat required to convert the ice to liquid water is given by: q= nhfus. In segment three, the amount of heat required to heat the liquid of water is given by: q=mct. In segment four (transition), the amount of heat required to convert the liquid to gas is given by: q=nhvap.